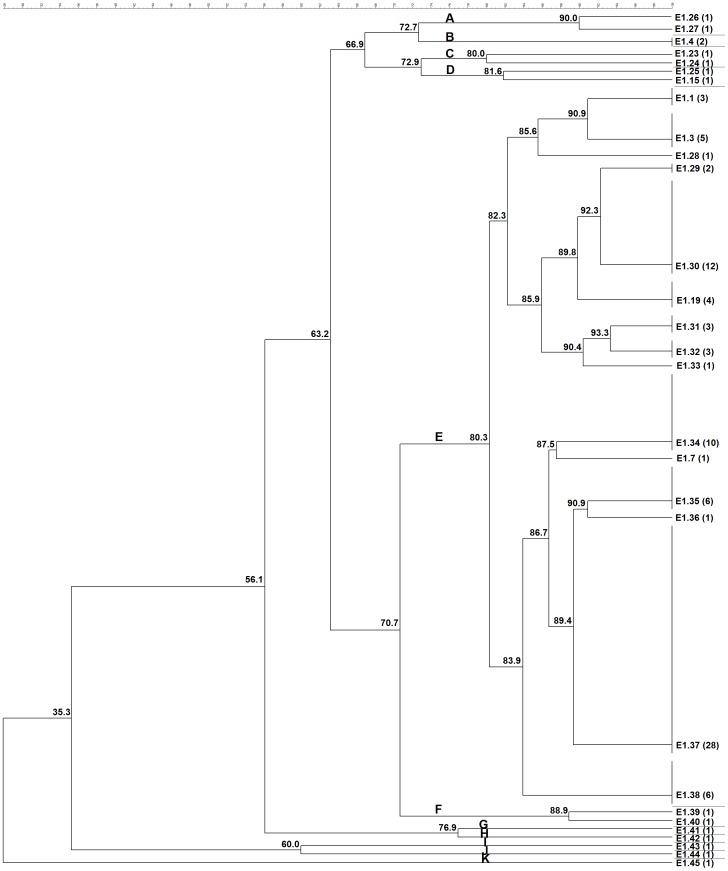
Figure 1. Cluster analysis by ERIC-PCR fingerprint (ERIC 1) of 99 C. pseudotuberculosis field isolates, 1002 vaccine strain and ATCC 19410T type strain.
Clustering analysis was performed with aid of BioNumerics 6.5 (Applied Maths, Sint-Martens-Latem, Belgium) and based on the Dice similarity coefficient and the unweighted pair group method with arithmetic mean (UPGMA). Eleven major clusters labeled A-K were defined from groups of closely related strains sharing on average ∼80% of genotype similarity. The numbers in parentheses correspond to the number of isolates within the genotype.

