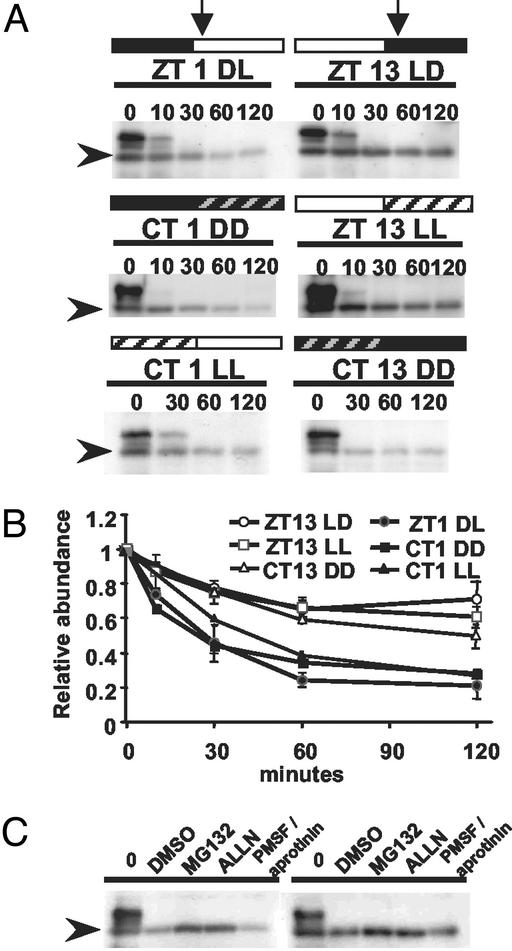
Fig 6.
Phase-specific and proteasome pathway-dependent degradation of ZTL in vitro. Shown is immunoblot analysis of ZTL levels in seedlings after cell-free protein degradation assay. (A) Cell-free degradation of ZTL. Extracts were prepared from different circadian time points (vertical arrows), ZT 1 DL and ZT 13 LD in LD cycles, CT 1 and CT13 in DD and CT1 and ZT 13 in LL, and incubated in an in vitro degradation buffer for the indicated time (min). (B) Quantitation of ZTL level changes in cell-free protein degradation system. ZT and CT time points are as in A. Values are relative to time 0 and are means of two to three trials ± SEM. (C) Cell-free degradation of ZTL. Extracts from ZT1 (Left) and ZT13 (Right) in LD cycles were incubated for 2 h with 2% DMSO (solvent control), 40 μM MG132 or ALLN, or protease inhibitor mixture (2 mM PMSF and 10 μg/ml aprotinin). Arrowheads indicate ZTL position.

