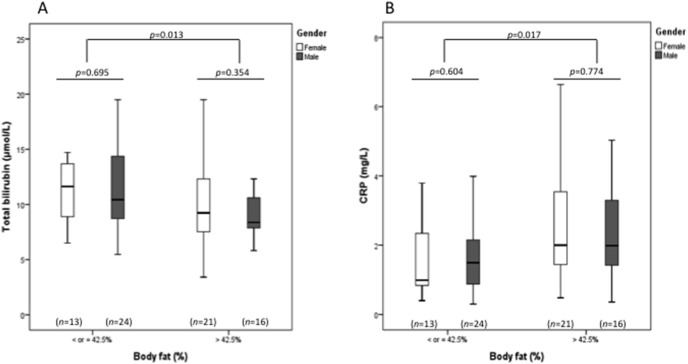
Figure 2. Total bilirubin (A) and C-reactive protein (B) levels in obese participants according to gender and to body fat percentage (n = 74), using the cut-off value of 42.5% (cut-off that corresponds to the median value for the obese group).
The boxes represent the interquartile range (IQR), with the upper and lower edges of the boxes representing the 75th and 25th percentiles, respectively. The central horizontal lines within the boxes represent median levels for each group. The vertical whiskers above and below the boxes represent the range of outlying data points up to 1.5 times the IQR.

