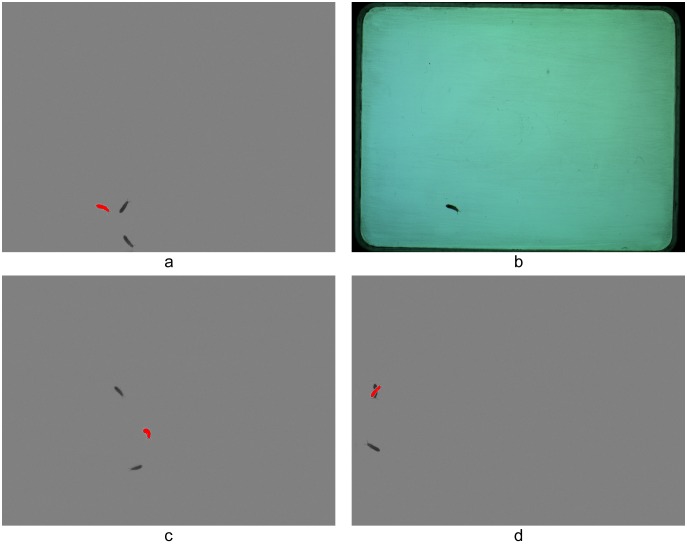
Figure 2. Secondary difference images produced by the CollScope image analysis software application.
In the resulting pictures individuals appear in three representations: red patches correspond to the animal’s spot involved in further calculations, while dark grey patches show its previous and next positions (a). Original photo (b), Collembolan bending in a crescent on the image or split during the image processing (c and d).

