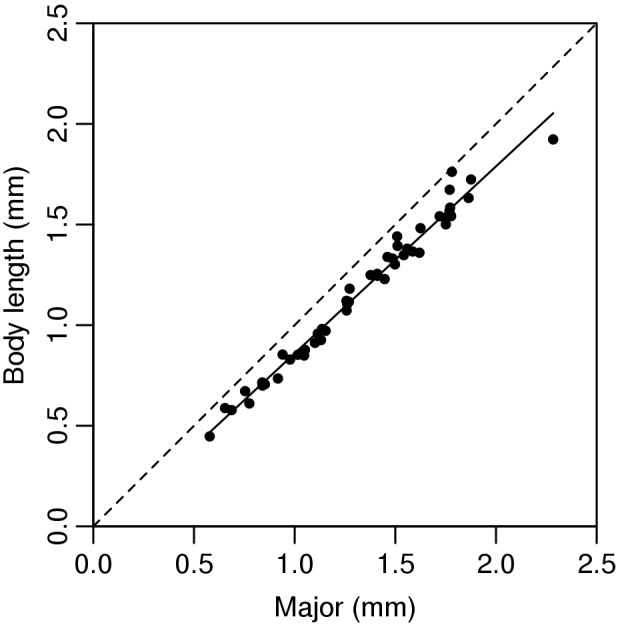
Figure 4. Relationship between the M values obtained from the image analysis and body length measured manually.

The broken line corresponds to y = x. The continuous line shows the prediction used in the calculations (n = 50 individuals).

The broken line corresponds to y = x. The continuous line shows the prediction used in the calculations (n = 50 individuals).