Figure 1.

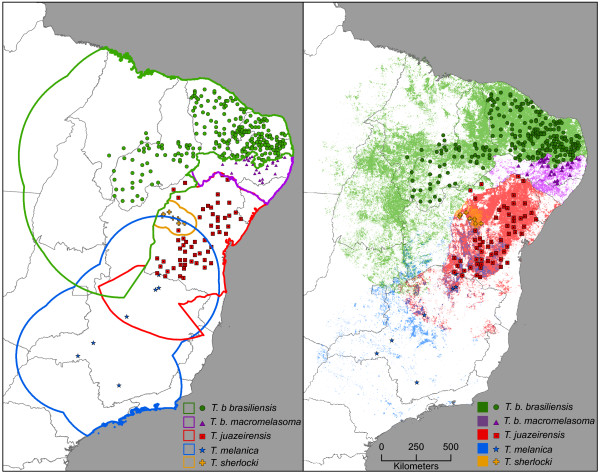
Left: Map of hypothesized accessible areas (lines) and occurrence data (points) for all species in the Triatoma brasiliensis species group. Right: Modeled current distributions for all members of the complex.

Left: Map of hypothesized accessible areas (lines) and occurrence data (points) for all species in the Triatoma brasiliensis species group. Right: Modeled current distributions for all members of the complex.