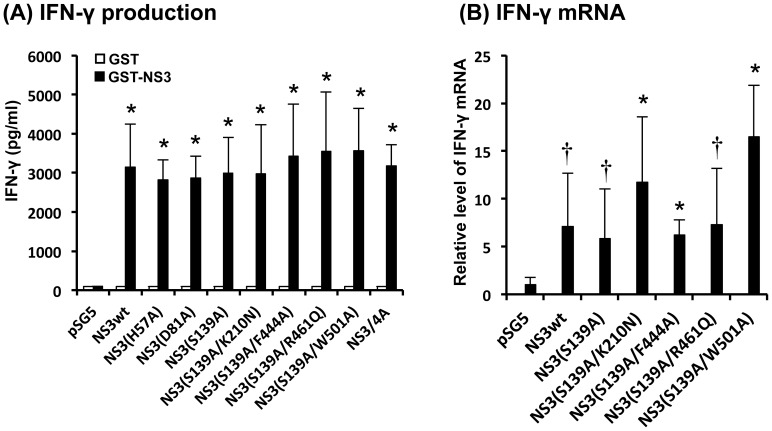
Figure 3. IFN-γ production induced by NS3 DNA vaccination.
(A) IFN-γ production by splenocytes obtained from immunized mice. BALB/c mice (2 mice/group) were immunized with each of the DNA vaccines expressing NS3wt, various NS3 mutants or NS3/4A. Splenocytes obtained from the immunized mice were cultured in the presence of GST-NS3 (5 µg/ml) for 72 h. The amounts of IFN-γ in culture supernatants were measured with ELISA. Data represent mean ± SEM of the data from three independent experiments. *, p<0.01 compared with the mock-immunized control. (B) IFN-γ mRNA expression. Splenocytes obtained from immunized mice were cultured in the presence of GST-NS3 (5 µg/ml) for 24 h. The amounts of IFN-γ mRNA were determined by real-time quantitative RT-PCR analysis and normalized to GAPDH mRNA expression levels. Data represent mean ± SEM of the data from three independent experiments. The value for splenocytes from the mock-immunized control was arbitrarily expressed as 1.0. *, p<0.01; †, p<0.05, compared with the control.

