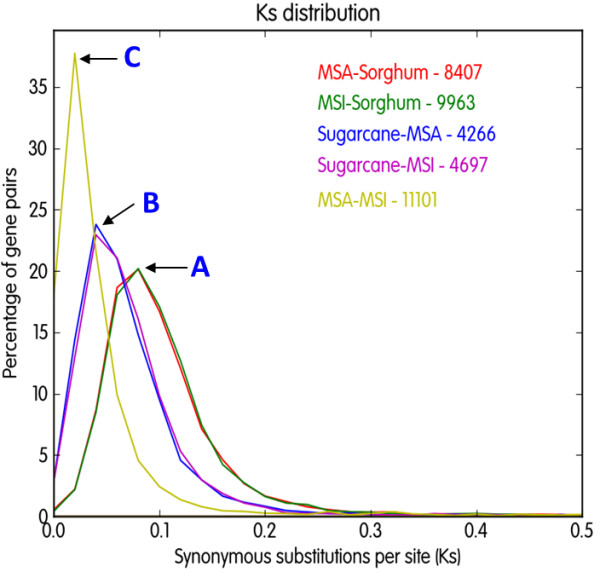
Figure 5.

Distributions of synonymous nucleotide substitution (Ks) values among tested grasses. The numbers next to species names indicate the number of orthologous sequences used for plotting Ks distributions. Each peak represents time points of speciation between two species. (A) Speciation of two subtribes, Sorghinae and Saccarinae based on the comparison of MSA – sorghum and MSI – sorghum (Ks = 0.08). (B) Speciation of Saccharum and Miscanthus genera based on MSA – sugarcane and MSI – sugarcane (Ks = 0.04). (C) Speciation between two Miscanthus species based on MSA-MSI (Ks = 0.02). MSA; M. sacchariflorus, MSI; M. sinensis.
