
Figure 6.
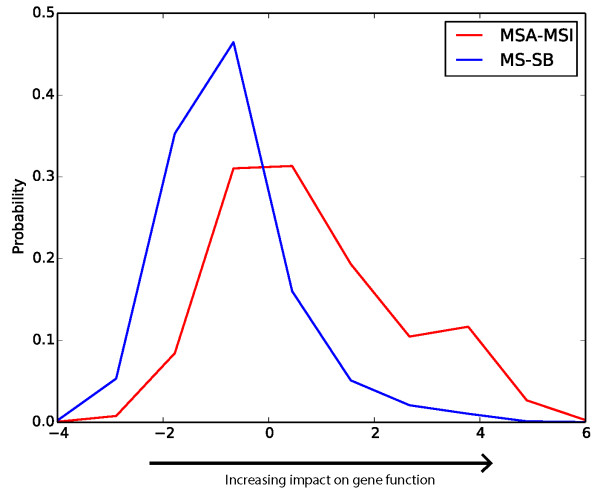
Distribution of nsSNP impact on protein function in the sorghum and Miscanthus lineages. Red line represents nsSNP between the two Miscanthus species. Blue line depicts nsSNPs between Miscanthus and sorghum.
Official websites use .gov
A
.gov website belongs to an official
government organization in the United States.
Secure .gov websites use HTTPS
A lock (
) or https:// means you've safely
connected to the .gov website. Share sensitive
information only on official, secure websites.
Distribution of nsSNP impact on protein function in the sorghum and Miscanthus lineages. Red line represents nsSNP between the two Miscanthus species. Blue line depicts nsSNPs between Miscanthus and sorghum.