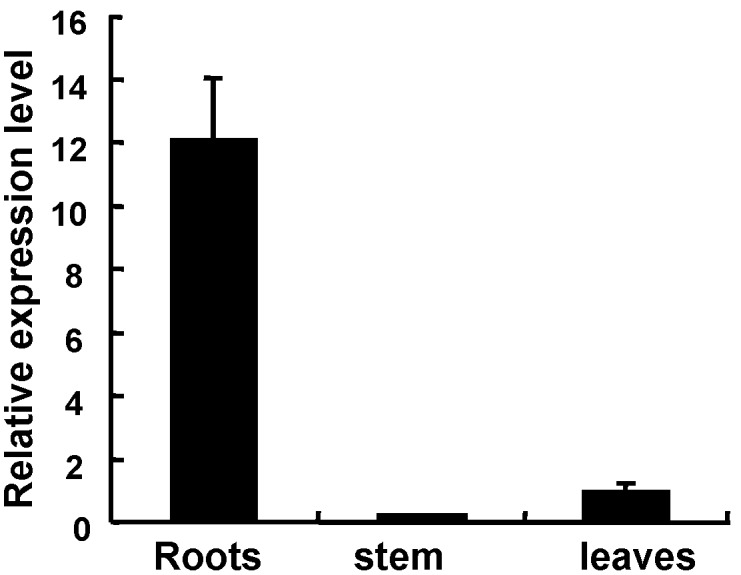
Figure 6. Expression level of Sali3-2 in different tissues of soybean seedlings.

The expression level in the leaves was set to 1, and the Tubulin gene was used as the internal control. The error bars represent SD.

The expression level in the leaves was set to 1, and the Tubulin gene was used as the internal control. The error bars represent SD.