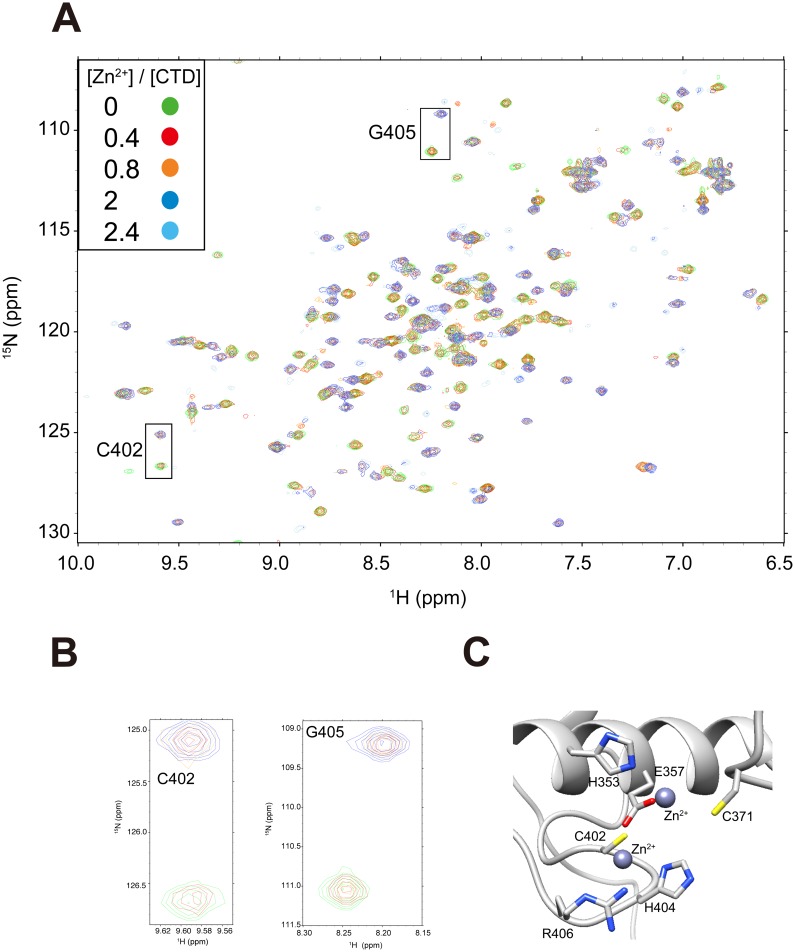
Figure 3. The characterization of interactions between aqMutL-CTD and Zn2+.
(A) The 1H-15N HSQC spectra of 100 µM aqMutL-CTD at the various concentrations of Zn2+ are superimposed. The representative peaks (C402 and G405) showing the slow exchange are indicated with the one-letter amino acid code and residue number. (B) The change in the chemical shift of C402 and G405. (C) Putative binding sites of Zn2+ are magnified (see the Materials and Methods). The side chains of H353, E357, C371, C402, and H404 are shown. The blue spheres indicate Zn2+ ions.

