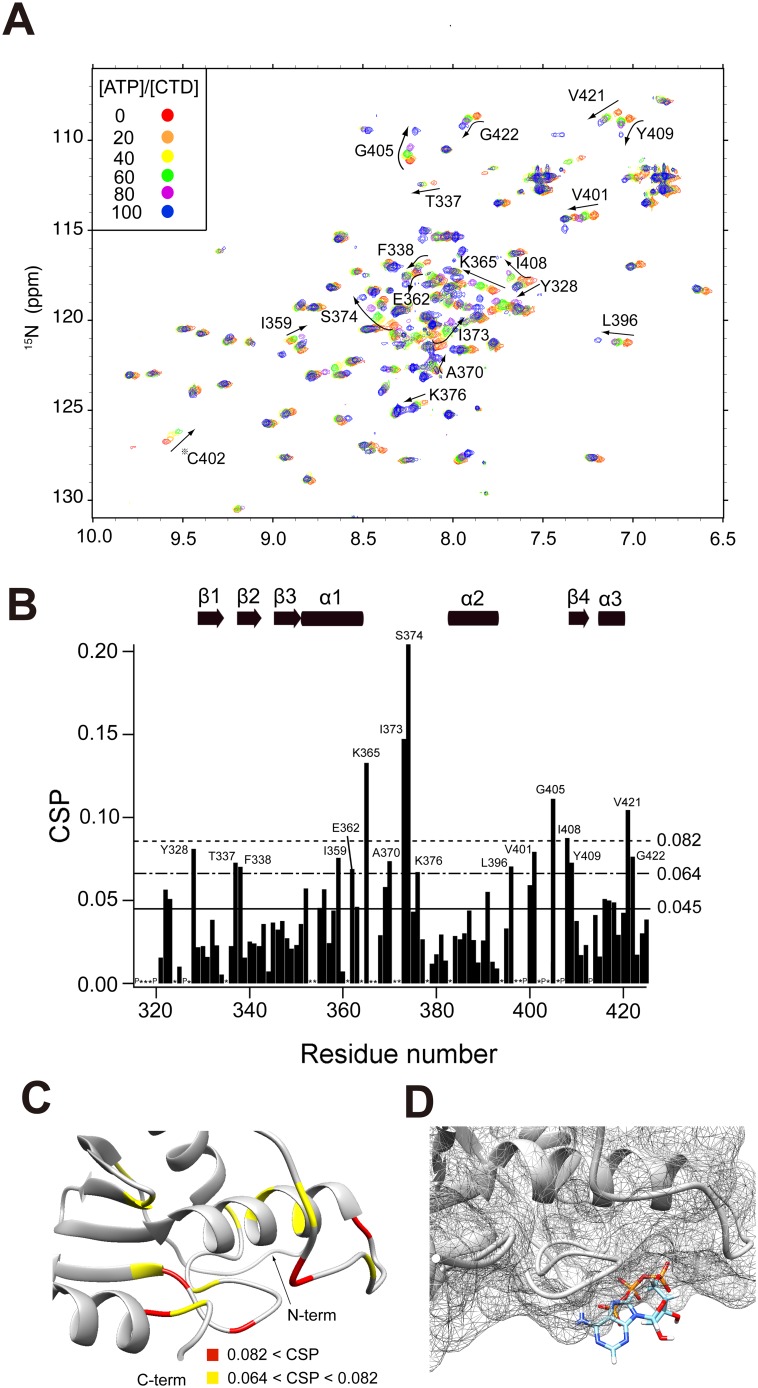
Figure 5. The characterization of interactions between aqMutL-CTD and ATP.
(A) The 1H-15N HSQC spectra of 100 µM CTD at various concentrations of ATP are superimposed. The residues displaying significant perturbations are labeled using a one-letter amino acid code and residue numbers. Peaks of C402 (?) disappeared after [ATP]/[CTD] = 80 as the titration proceeded; it was then ruled out in the chemical shift perturbation (CSP) analysis. However, the label was displayed for the discussion below. (B) CSPs of the CTD in the presence of 8 mM ATP were plotted against residue numbers. The bottom solid line represents the ″mean value (0.045)″. The middle and upper dotted lines signify ″mean value+0.5× standard deviation (0.064)″ and ″mean value + standard deviation (0.082)″ for significant changes, respectively. (C) The degree of the perturbation was mapped onto the model structure with the color code: Red, CSP>0.082, yellow, 0.082>CSP>0.064. (D) The complex structure of the CTD and ATP as obtained by the docking simulation using MyPresto/Sievgene (see the Materials and Methods). The interacting sites are enlarged (right). ATP and aqMutL-CTD are represented by a ball and stick model and meshed surface model, respectively.

