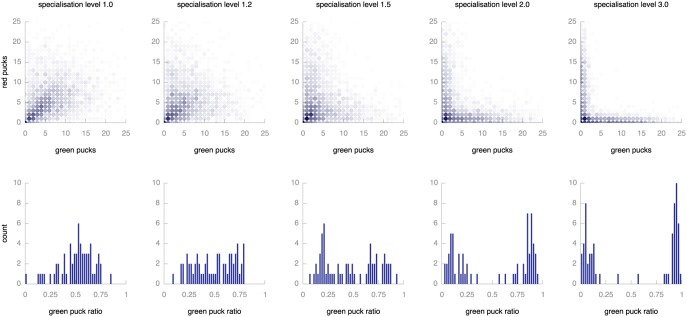
Figure 12. Effect of increasing pressure towards specialisation.
The top row of graphs shows the level of specialisation of individual robots. Each circle represents a combination of red (vertical axis) and green (horizontal axis) pucks. Circles on the diagonal represent individuals that gather equal amounts of red and green pucks, circles on the axes represent specialised individuals. The colour intensity indicates the number of individuals (combined over 64 repeats of the experiment) that combined that particular combination during their lifetime. The bottom row contains histograms of green puck ratios across the population. Populations with a ratio of 0.5 are perfectly balanced, more extreme values indicate specialisation of the whole population on either type of puck. All plots report on the final 1,000 time steps of simulation.

