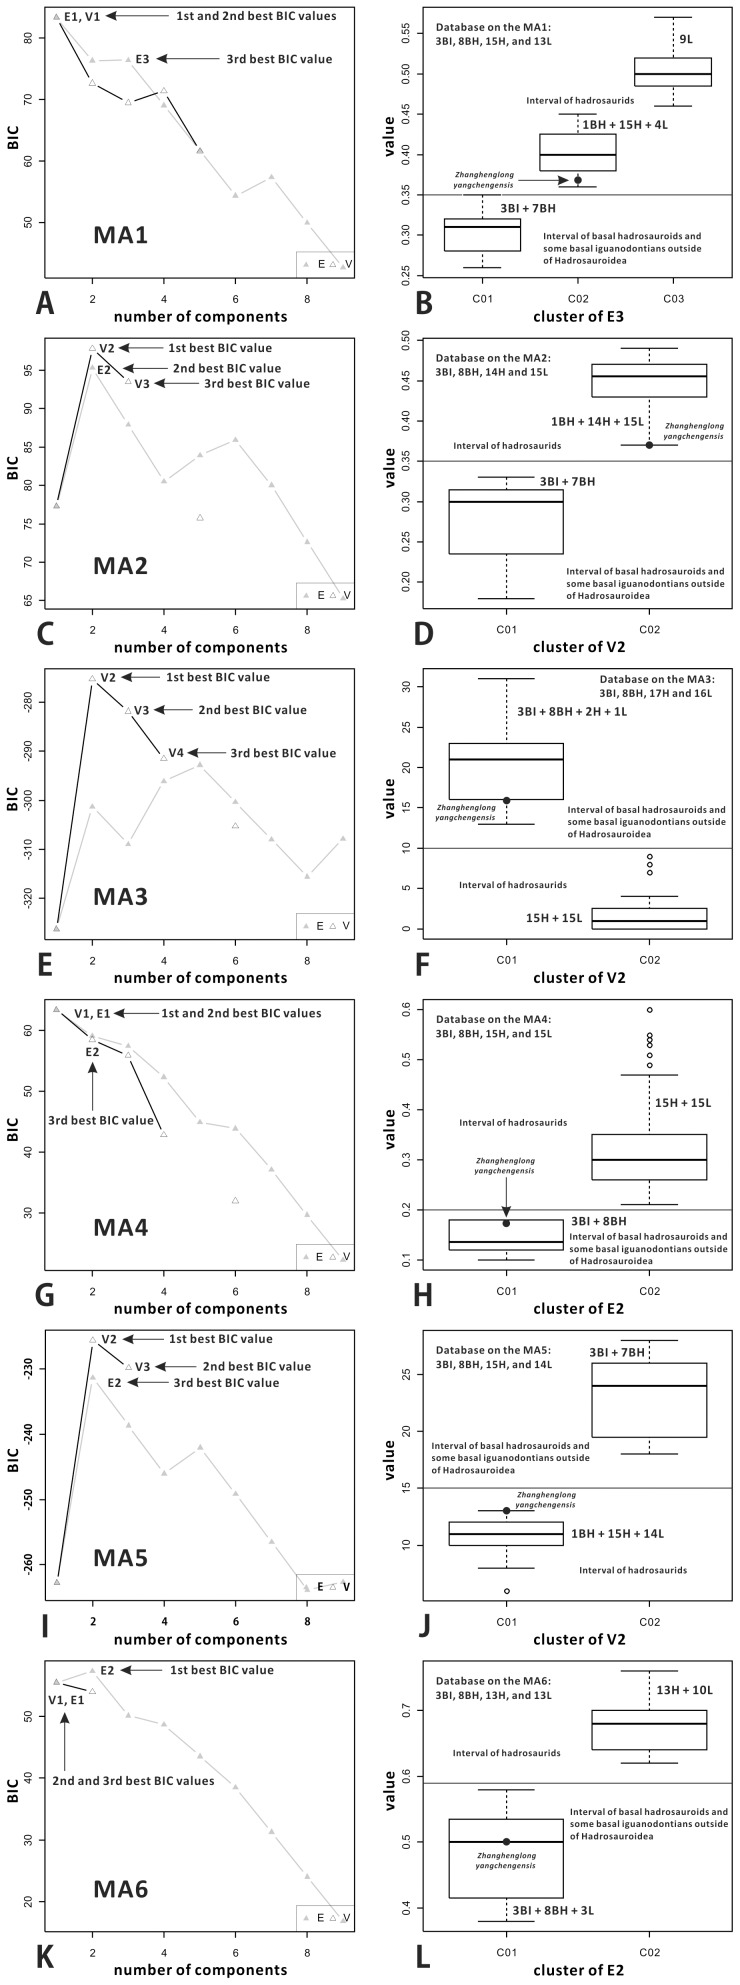
Figure 12. Bayesian Information Criterion (BIC) plots showing the results of model-based cluster analysis (MCA) implemented in Mclust for the datasets consisting of the values of most hadrosauroids and some basal iguanodontians on six selected measurement attributes (MA) derived from some phylogenetic characters, with the corresponding simplified box plots of the datasets showing the detached intervals respectively related to basal hadrosauroids and hadrosaurids.
BIC plot (A) and box plot (B) for MA1. BIC plot (C) and box plot (D) for MA2. BIC plot (E) and box plot (F) for MA3. BIC plot (G) and box plot (H) for MA4. BIC plot (I) and box plot (J) for MA5. BIC plot (K) and box plot (L) for MA6. Abbreviations: BH, basal hadrosauroids; BI, basal iguanodontians outside of Hadrosauroidea; H, hadrosaurines; L, lambeosaurines.

