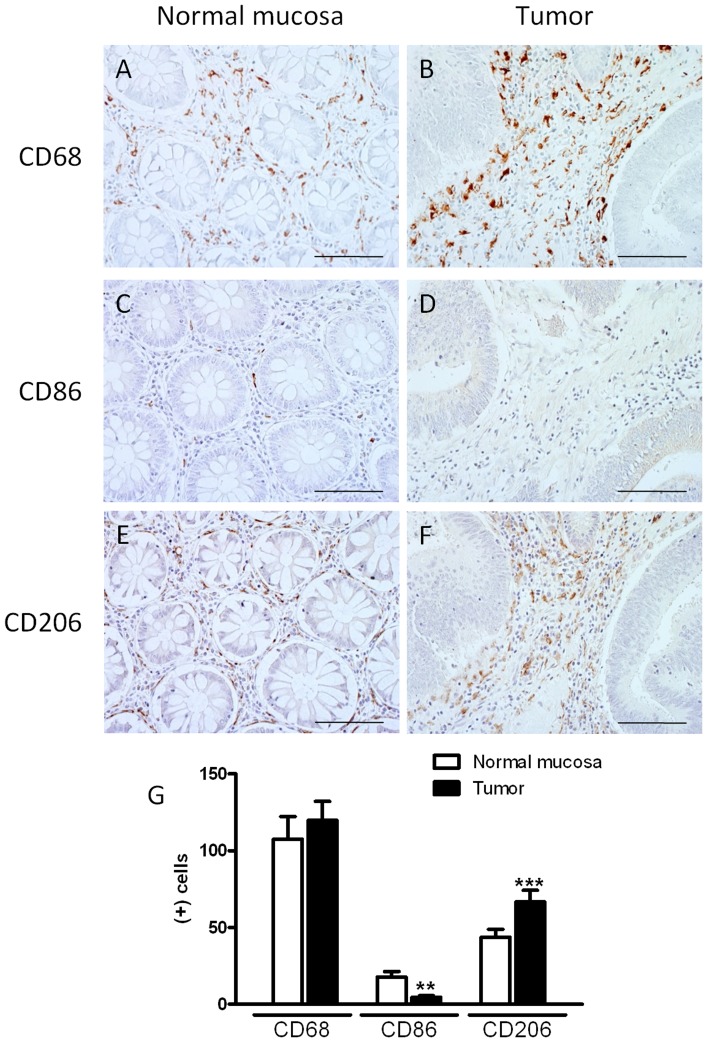
Figure 1. Pattern of macrophage infiltration in colorectal cancer and healthy surrounding tissues.
The immunoreactivity to CD68 (MF marker, A–B), CD86 (M1-MF marker, C–D) and CD206 (M2-MF marker, E–F) was analyzed in colorectal cancer (B, D, F) and healthy surrounding mucosa (A, C, E). (G) Quantitative analysis of positive cells for these molecules in a representative area of 0.22 mm2 (Scale bar = 0.2 mm). Bars represent mean ±SEM (n = 21). **P<0.01 and ***P<0.001 vs corresponding value in normal mucosa.

