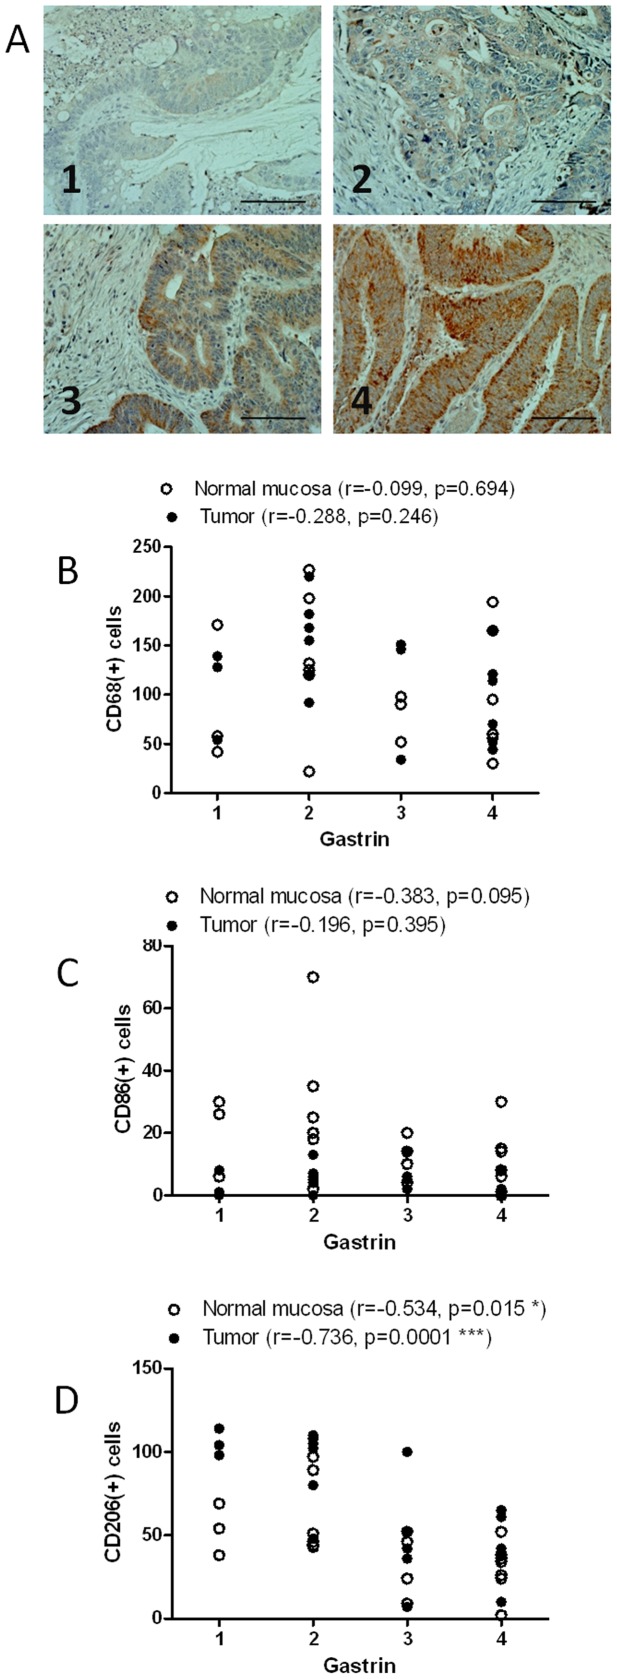
Figure 2. Relationship between gastrin expression and the pattern of macrophage infiltration in colorectal cancer samples.
The number of total macrophages (CD68 + cells, B), M1-macrophages (CD86+ cells, C), and M2-macrophages (CD206 cells, D), in the tumor and normal surrounding tissue were analyzed in relation to gastrin expression in tumoral tissue (A, score 1 to 4, scale bar = 0.2 mm). A negative and significant correlation is observed between the intensity of gastrin staining and the number of M2-macrophages in normal mucosa and tumoral tissue (D).

