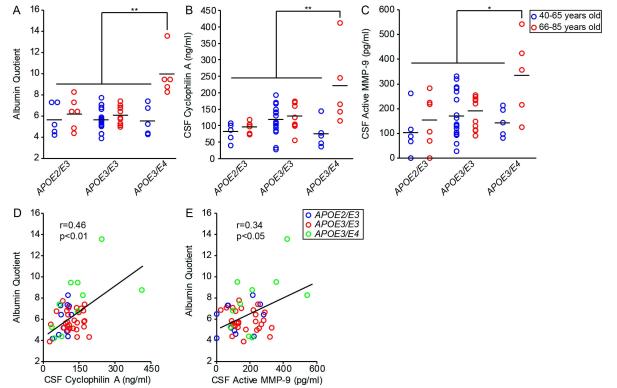
Figure 1. Age-dependent blood-brain barrier breakdown and elevated cyclophilin A and active MMP-9 levels in cerebrospinal fluid (CSF) of cognitively normal APOE4 carriers.
CSF/plasma albumin quotient (A), CSF levels of cyclophilin A (B), and CSF levels of active MMP-9 (C) in a population of cognitively normal individuals on three different APOE genotypes: APOE2/E3 (n = 11), APOE3/E3 (n = 28), and APOE3/E4 (n = 10). Blue and red points represent individuals ranging from 40-65 and 66-85 years of age, respectively. Pearson correlation coefficients (r) were calculated to study the relationship between CSF cyclophilin A (D) and CSF active MMP-9 (E) levels with albumin quotient in individual subjects. In (D) and (E), blue, red and green points represent APOE2/E3, APOE3/E3 and APOE3/E4 genotypes, respectively. Points represent individual values from n = 49 subjects. Black bars represent mean values. * = P < 0.05 and ** = P < 0.01

