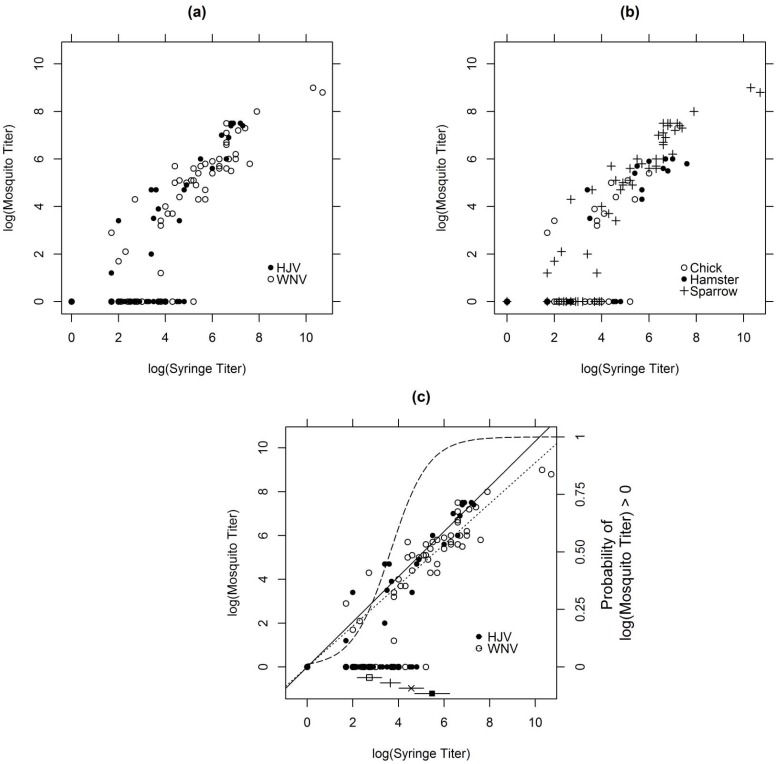
Figure 1. Corresponding virus titers (log10 pfu/mL serum) derived from mosquito- and syringe-drawn blood.
Data for viruses (a) or animals (b). Panel (c) shows the data by virus with graphical representations of the linear (scale on left margin) and logistic (scale on right margin) components of the final fitted model. Also shown below the horizontal 0 in panel (c) are estimates and 95% confidence intervals for the syringe-measured titers that have 25% (o), 50% (+), 75% (×), and 90% (▪) probabilities of obtaining a positive mosquito-measured titer.

