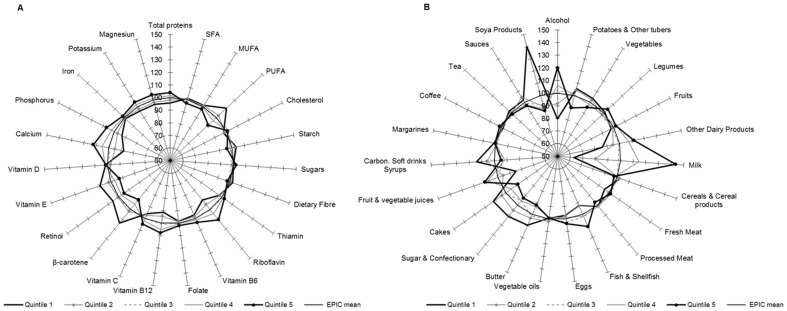
Figure 5. Deviation (%) of the 24-HDR mean intakes from the overall ‘EPIC means’ among participants in the quintiles of PC4 scores for nutrients (A) and foods (B).
Means are adjusted for age, sex, height, weight and energy and weighted for day and season of recall (N = 34,436). The reference circle of the radius (100%) correspond to the ‘EPIC means’ and the spikes indicate the deviation of the specific nutrient mean in quintiles of pattern scores from the reference ‘EPIC means’.

