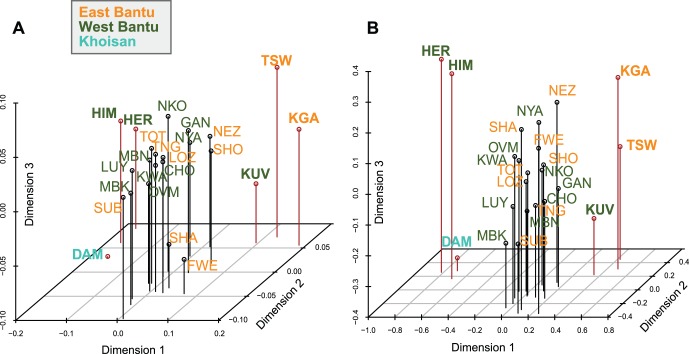
Figure 2. Three-dimensional MDS analysis based on pairwise ΦST values between populations.
Color coding by linguistic affiliation; abbreviations of population labels are as specified in Table 1. A. Including all sequences, stress = 5.35 B. Excluding L0d and L0k sequences, stress = 5.34. Populations discussed in the main text are highlighted with bold font and a red line in the plot.

