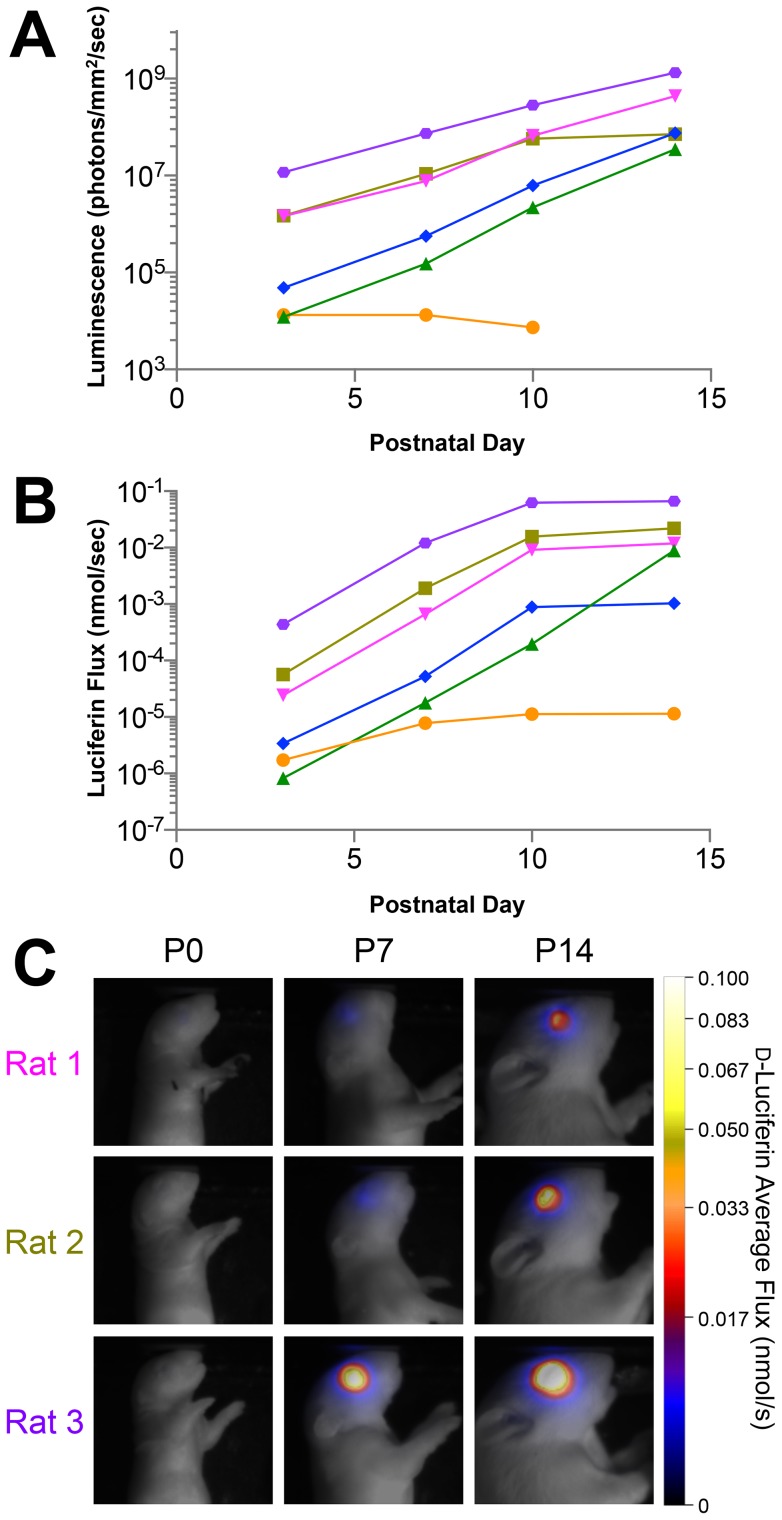
Figure 3. Modeling of luciferin flux from bioluminescence imaging (BLI) data reveals slowing of tumor growth over time.
(A) Conventional peak luminescence imaging of xenografts in six individual animals (each animal is one colored line) shows exponential tumor growth in the majority of animals. (B) Calculated luciferin flux ( ) modeled (Equations 1–3) from BLI data over the 14-day study. (C) Pseudo-color parametric images of
  for three representative animals at three timepoints, color-coded as in (A).

