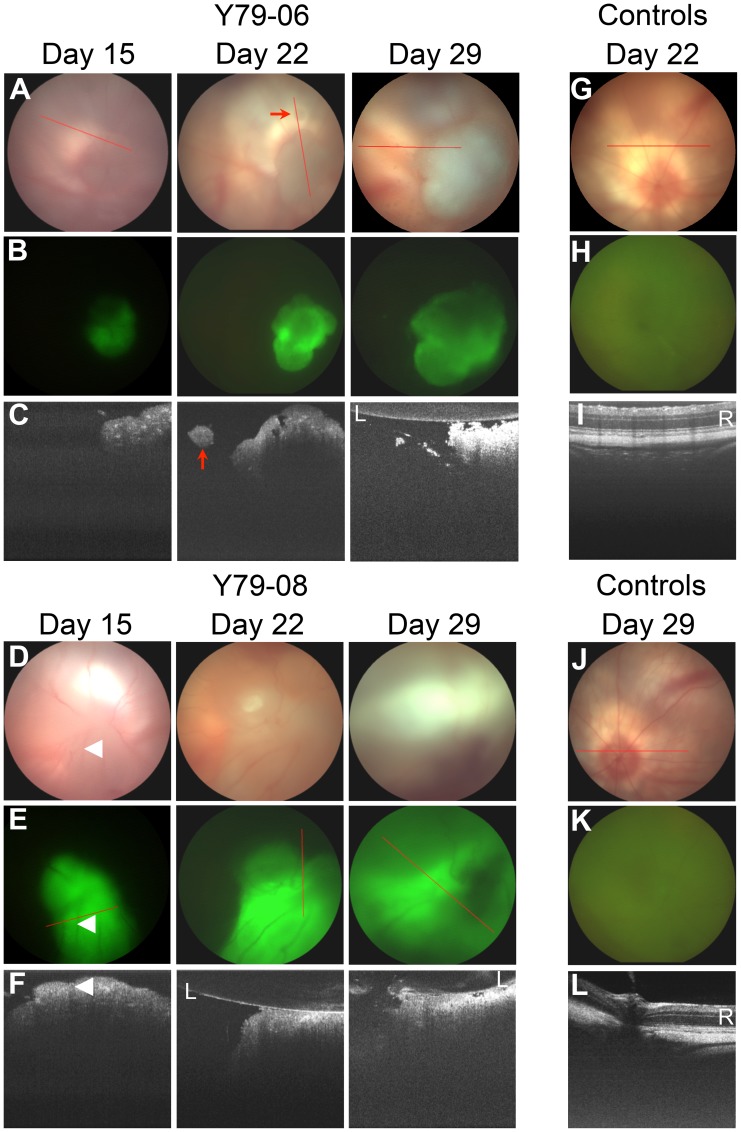
Figure 5. Characterization of pathology induced by Y79-EGFP-luc retinoblastoma cell xenografts or control injections.
Brightfield (A,D,G,J), green fluorescence (B,E,H,K), and OCT (C,F,I,L) imaging over a 4 week period shown. Tumors were highly vascularized (white arrowheads) and had well-defined edges as seen on brightfield and fluorescence imaging. OCT provided some additional depth resolution not possible with the other two modalities, although this was limited by shadowing of posterior features. OCT was also able to identify small, distinct satellite tumors growing independent of the main tumor mass (red arrows). Red lines indicate the OCT planes; L, lens; R, retina.

