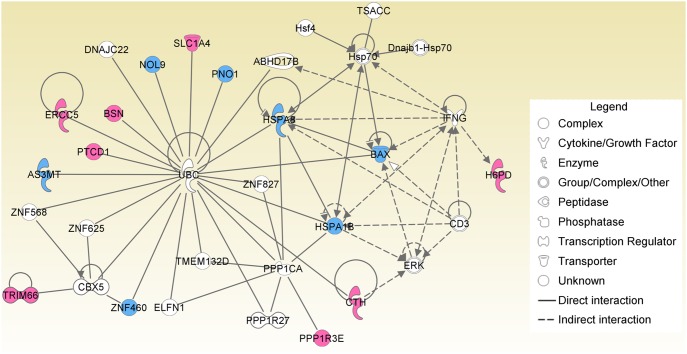
Figure 3. Interaction network of differentially expressed genes caused by BPA exposure.
Genes are represented as nodes with various shapes for different types. Red and blue nodes indicate up-regulated and down-regulated genes induced by BPA, respectively. Connective edges represent various types of biological relationships among these genes.

