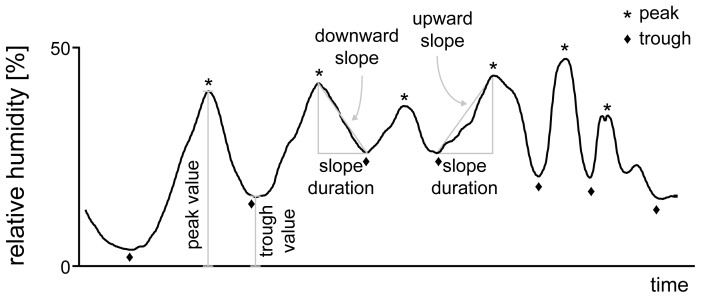
Figure 2. Humidity profile showing the parameters analysed.
Peak and trough amplitudes are values over the zero level, durations of the upward and downward slopes are the periods between successive peaks and troughs, and the values of the upward and downward slopes are the velocities with which humidity is rising and falling, respectively.

