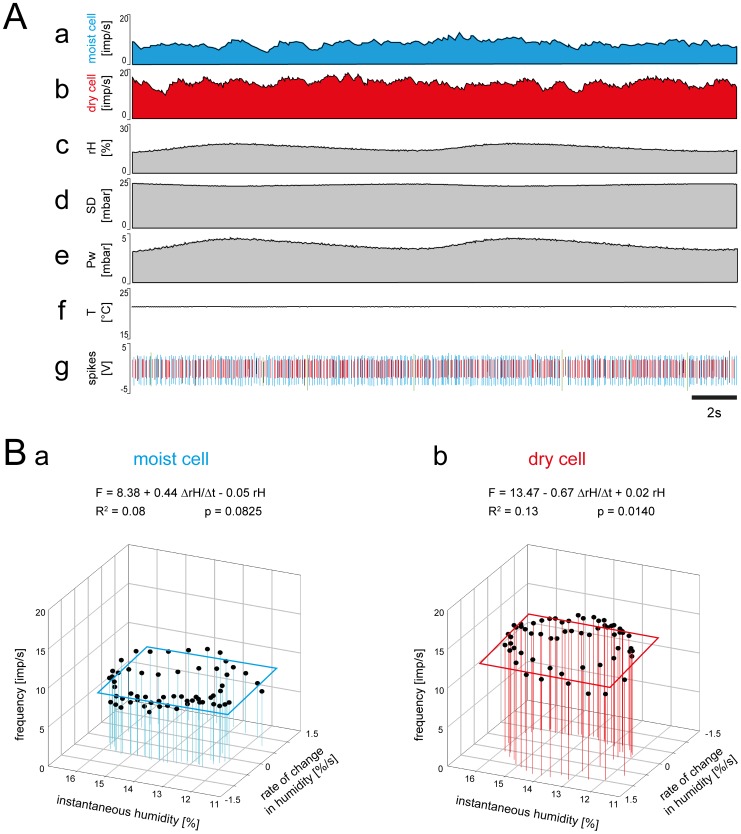
Figure 7. Simultaneously recorded responses of a pair of moist and dry cells from a single sensillum to small amplitude changes in humidity.
A. Time course of the responses and the parameters controlled during the recording, and the corresponding activity of the moist and dry cells. a and b, instantaneous impulse frequency of both cells. c, time course of the relative humidity. d, time course of the saturation deficit. e, time course of the water vapor pressure. f, time course of the temperature. g, digitized action potentials of the moist and dry cells recorded with a single electrode and discriminated on-line. B. Impulse frequency of the moist and dry cells during the oscillations in relative humidity shown in A plotted as a function of instantaneous relative humidity and its rate of change. Multiple regressions which utilize 3-dimensional planes (F = a+b drH/dt+c rH; where F is the impulse frequency, and a the height of the regression plane) were calculated to determine the simultaneous effects of the rate of change in the relative humidity (b slope) and the instantaneous relative humidity (c slope) and the response frequency of both cell types. Pw water vapor pressure, R2 coefficient of determination, rH relative humidity, SD saturation deficit, T temperature, V volt.

