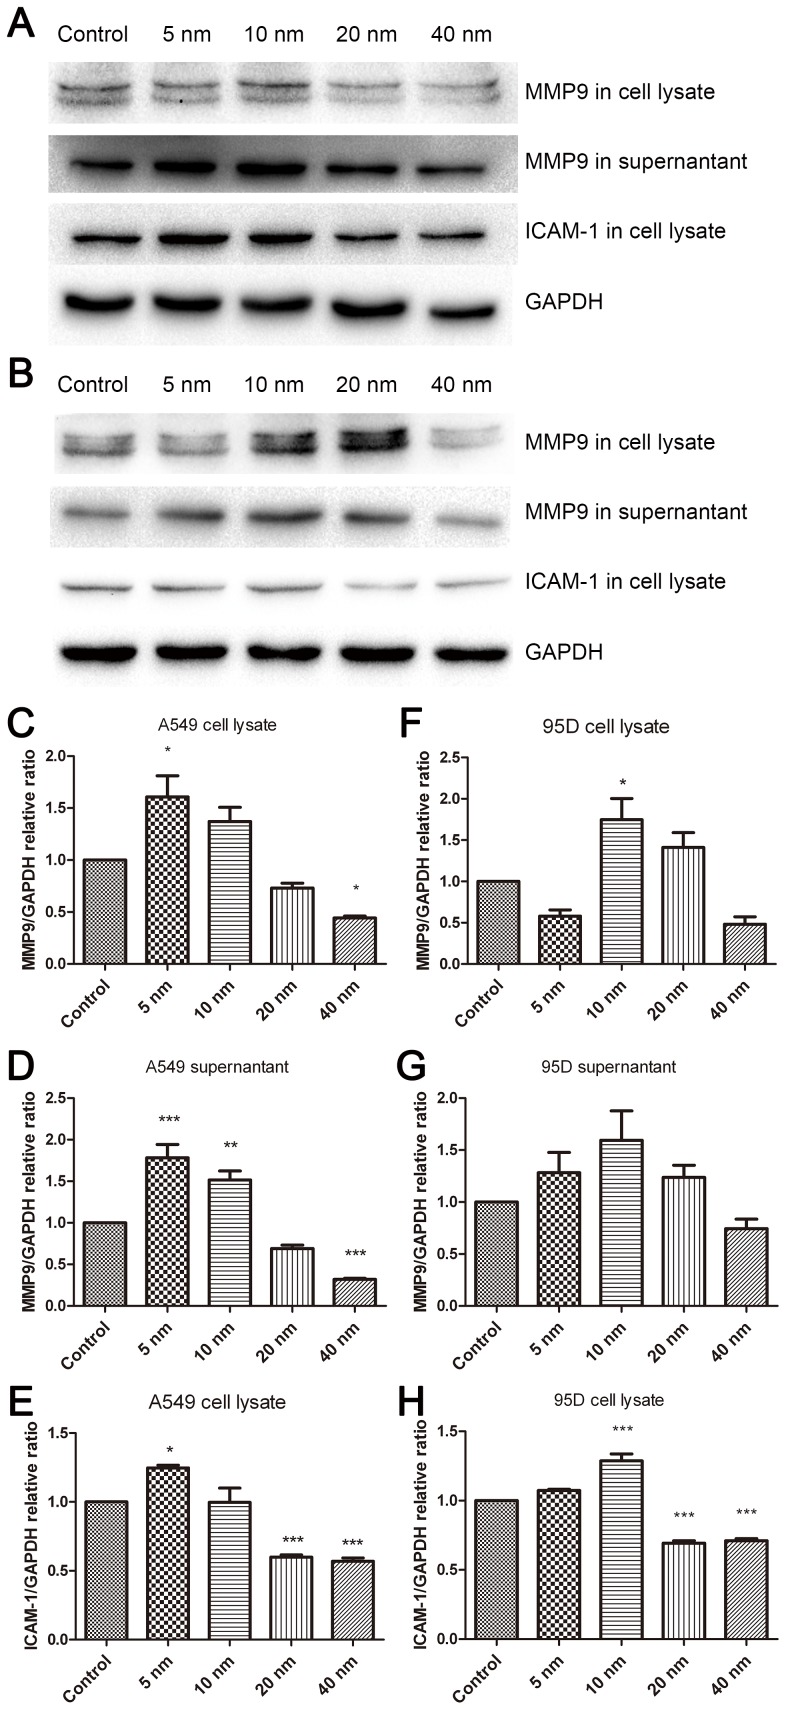
Figure 7. Western blot analysis of the expression of MMP9 and ICAM-1 in A549 and 95D cells.
Representative results showing the effect of Au-NPs treatment on the expression of MMP9 and ICAM-1 in A549 (A) and 95D (B) cells. Relative band density of MMP9 and ICAM-1 to the mean value of the control group (C–H). Values are expressed as relative intensity normalized to GAPDH intensity and are given as mean ± SD from three independent experiments. *P<0.05, **P<0.01, ***P<0.001 vs. control.

