
Figure 5. S1333A-ATR expressing cell lines contain elevated levels of phosphorylated ATR substrates.
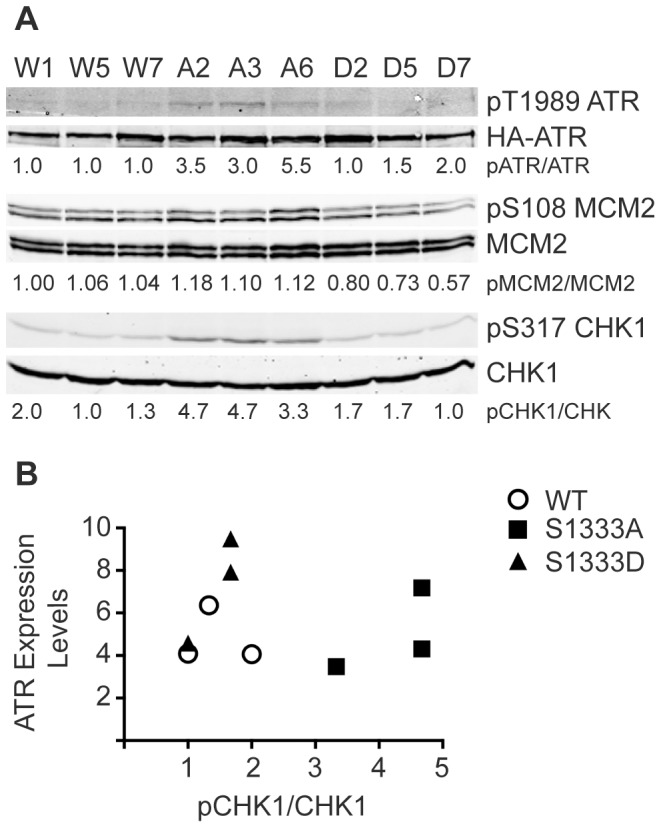
(A) Lysates from ATR−/− cell clones expressing wild type (W1, W5, W7), S1333A (A2, A3, A6), or S1333D (D2, D5, D7) ATR proteins were separated by SDS-PAGE and immunoblotted with the indicated antibodies. Quantitative immunoblotting was used and the ratio of phosphorylated protein to total protein normalized to wild type (W1) is listed below each lane. Note that three clonal isolates for each ATR protein were analyzed to ensure results were not due to clonal variation. All cell lines were examined multiple times and a representative experiment is shown. (B) The ratio of pCHK1/CHK1 and the expression levels of ATR are compared to show that the small differences in ATR expression levels in different cell lines do not account for the change in substrate phosphorylation.