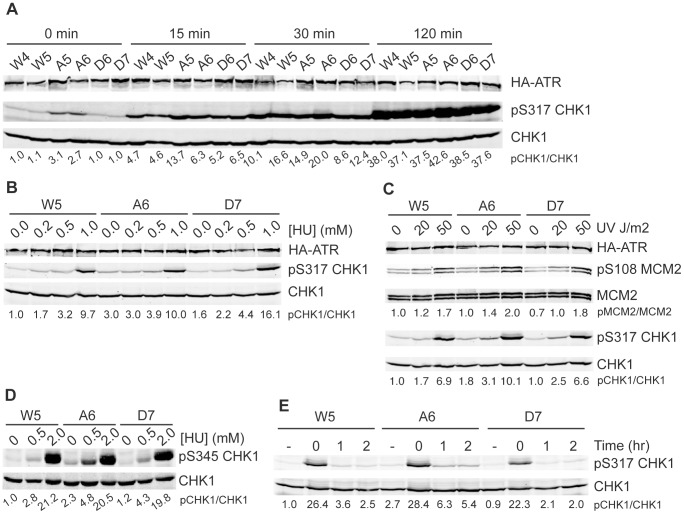
Figure 6. S1333A-ATR expressing cell lines maintain elevated levels of phosphorylated substrate at low replication stress levels.
(A–E) Cell lysates were separated by SDS-PAGE and analyzed by quantitative immunoblotting using the indicated antibodies. Quantitative immunoblotting was used and the ratio of phosphorylated protein to total protein and then normalized to wild type is listed below each lane. (A) ATR−/− cell clones expressing wild type (W4 or W5), S1333A (A5 or A6), or S1333D (D6 or D7) ATR proteins were challenged with 2 mM HU for increasing lengths of time, (B) with increasing concentrations of HU for 4 hours, or (C) increasing doses of UV and allowed to recover for 2 hours. (D) Cells were treated with increasing doses of HU for 2 hours. (E) Cells were challenged with 2 mM HU for 2 hours and allowed to recover for 0, 1, or 2 hours. (−) indicates untreated cells. All experiments are representative images of at least two replicates.

