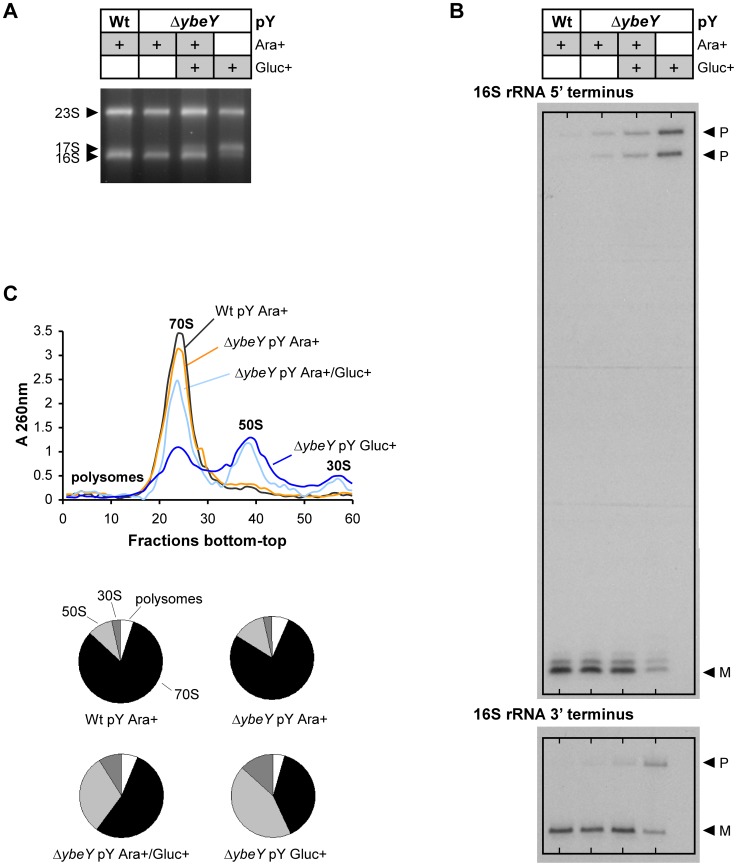
Figure 3. Analysis of rRNA and ribosome profiles in V. cholerae ΔybeY.
A) Total RNA was isolated from C6706 Wt pY and the ΔybeY pY strain grown in the presence of arabinose or glucose as specified and analyzed by agarose gel electrophoresis. The positions of 23 S, 17 S, and 16 S rRNAs are indicated based on their mobility. B) The 5′ and 3′ termini of 16 S rRNA from C6706 Wt pY and the ΔybeY pY strain were mapped as described in detail in Materials and Methods. “P” and “M” specify the positions of bands derived from the precursor and mature forms of 16 S rRNA. C) Ribosome profiles for C6706 Wt pY and the ΔybeY pY strain (top); quantitation of polysomes, 70 S, 50 S and 30 S ribosomes (bottom pie charts). “pY” indicates that ybeY is expressed from a plasmid. Ara+, cells were grown in LB in the presence of arabinose. Gluc+, cells were grown in LB in the presence of glucose. Ara+/Gluc+, intermediate YbeY depletion by switching the carbon source of the ΔybeY pY strain in early exponential phase from arabinose to glucose (for details see Materials and Methods).

