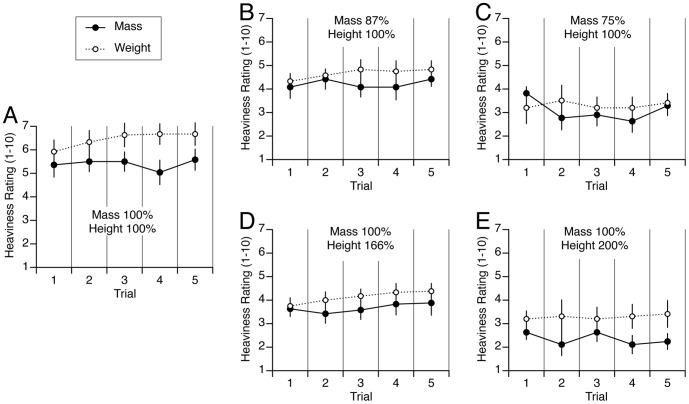
Figure 1. Comparison between heaviness rating of mass and weight for the five trials (mean ± SE of 12 subjects) with the five objects used in Experiment 1.
Each graph represents the heaviness ratings of mass and weight for one object. In Figure 1A , the object had a mass of 354 gr and a height of 7.6 cm. This object referred to as the reference cube (mass 100%, height 100%). In Figure 1B and 1C , the objects had the same height (100%) but a smaller mass (87%, and 75%, respectively). In Figure 1D and 1E , the objects had the same mass (100%) but a larger height (12.7 and 15.2 cm, or 166% and 200% respectively). Except for the object shown in Fig. 1C, for all the other objects the heaviness ratings was significantly different between mass and weight (one-way ANOVA, p<0.01).

