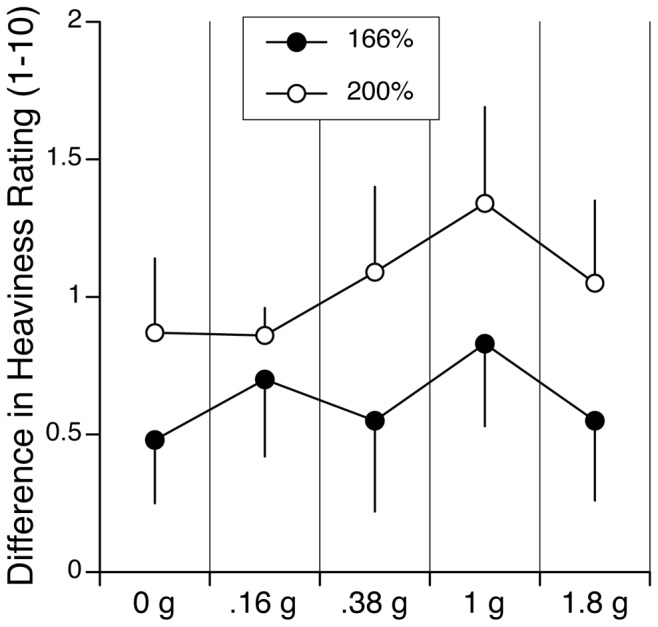
Figure 6. Differences in heaviness ratings between the smallest cube and the objects that were 166% and 200% larger than the smallest cube for the various gravity levels (mean and SE; N = 6 subjects in 0.16 g and 0.38 g; N = 12 subjects in zero g and 1.8 g; N = 18 subjects in one g).

All objects had the same mass (1 kg). The magnitude of the size-mass illusion was larger for the taller objects at all gravity levels.
