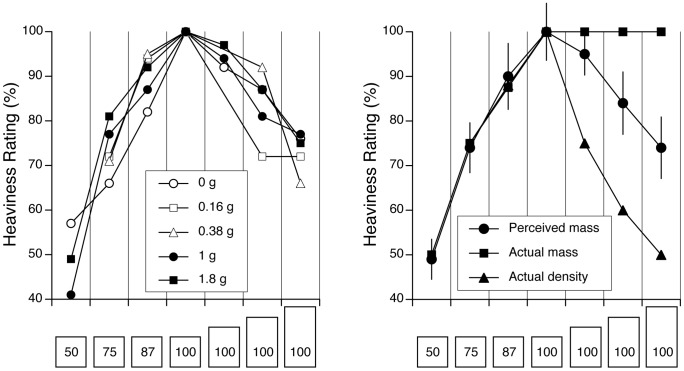
Figure 7. Heaviness ratings expressed in percent relative to the reference cube for the seven objects at each gravity level (mean of all trials and subjects) (A).
Comparison between the perceived mass at all gravity levels combined (mean ± SD of data shown in A) and the actual mass and density of the objects (B).

