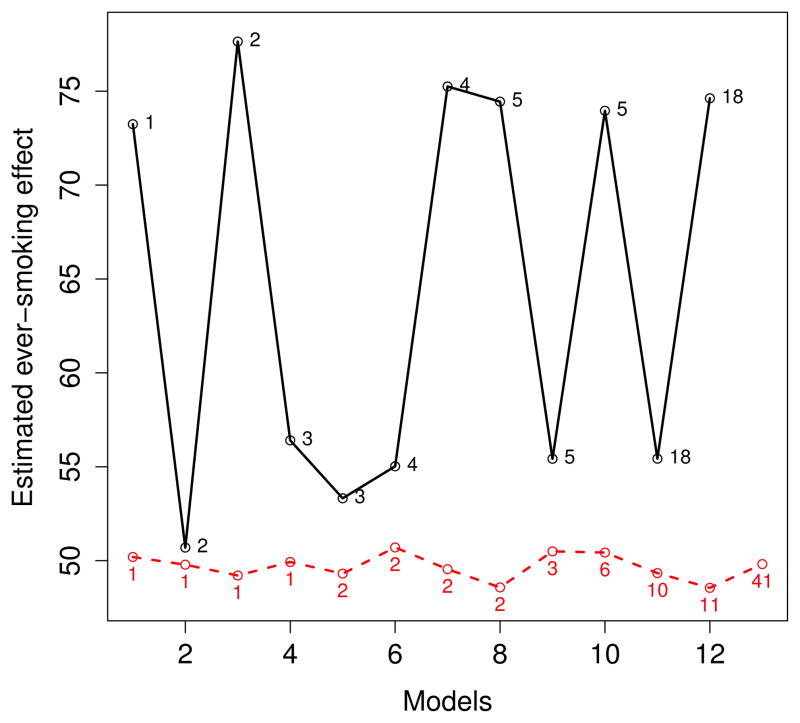
Figure 3.
Estimated ever smoking effect on CCA IMT (in μm) for the most likely outcome models according to model averaging (solid line) and BAC (slashed line). Numbers in the central part of the graph represent posterior probabilities (pp) in %. Estimated ever smoking effect are presented by model in increasing order of pp (only models with pp > 0.01 are shown).

