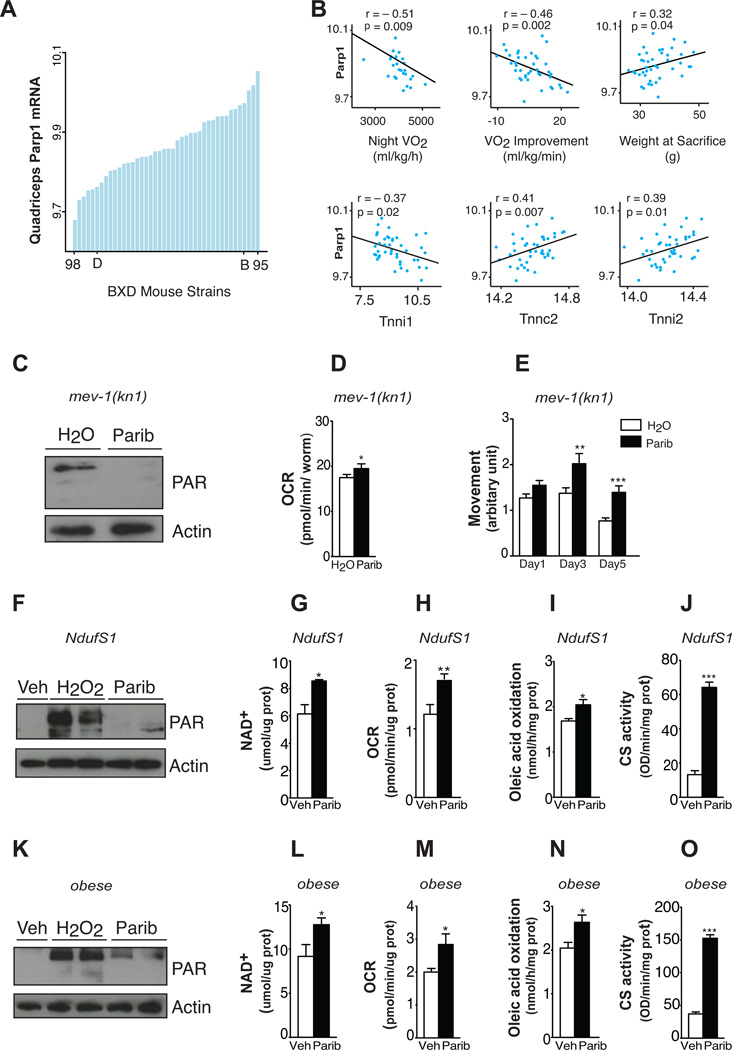
Figure 4. Parp activity negatively correlates with energy expenditure in mouse populations and its inhibition improves mitochondrial function in worm and human models of mitochondria dysfunction.
(A) Expression of Parp-1 in the quadriceps of 37 strains of BXD mice. Each bar represents mRNA from a pool of ~5 animals per strain. Extreme strains and the parental strains are labelled. (B) Top: Correlation between quadriceps muscle Parp-1 expression and phenotypes collected from BXD mice. Night VO2 was measured though indirect calorimetry. VO2 improvement represents the increase in VO2max after 10 days of voluntary exercise. Bottom: Correlation between quadriceps muscle Parp-1 and muscle fiber type genes in the same dataset. (C) Total PAR content at day 2 of adulthood (n=~500 worms/sample) in mev-1(kn1) complex II-deficient C. elegans after water and 100nM MRL-45696 treatment. (D) Respiration at day 3 (n=10 worms/well, 19 wells/group) and (E) movement at day 1, 3 and 5 of adulthood (n=37–90 worms/group). (F) H2O2 (500µM)-induced PARylation after 48hr pretreatment with either vehicle (Veh) or 100nM MRL-45696 in NDUFS1 mutant human fibroblasts. (G–J) NAD+ levels (G), O2 consumption rates (H), oleic acid oxidation (I) and CS activity (J) in human NDUFS1 mutant fibroblasts after Veh and 100nM MRL-45696 for 48hr (n=3–12 samples/group). (K) H2O2 (500µM)-induced PAR content after 24hr pretreatment with either Veh or 10nM MRL-45696 in human primary myotubes. (L–O) NAD+ levels (L), O2 consumption rates (M), oleic acid oxidation (N) and CS activity (O) in human primary myotubes after Veh or 10nM MRL-45696 treatment for 72hr (n=6–12 samples/group). * indicates statistical significant difference vs. respective Veh group. *, p<0.05; **, p<0.01; ***, p<0.001.

