Figure 1.

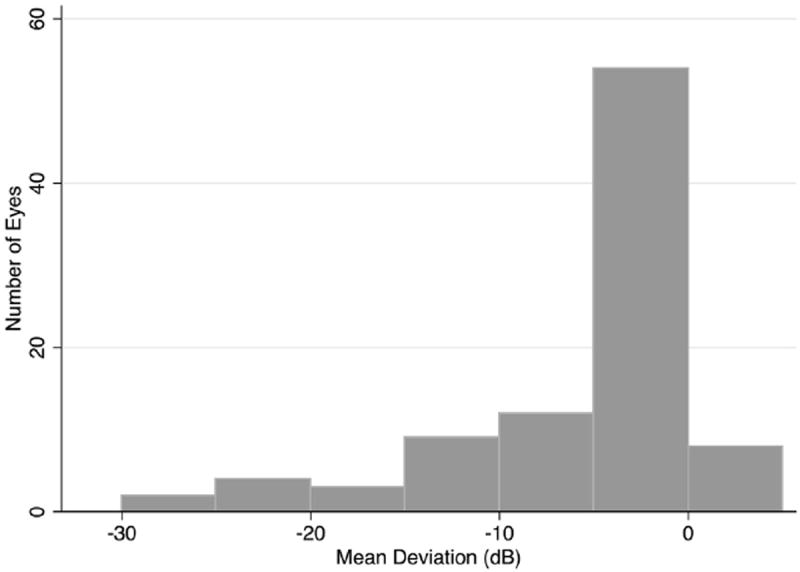
Bar graph showing the distribution of disease severity, measured as mean deviation in decibels (dB) in glaucomatous eyes.

Bar graph showing the distribution of disease severity, measured as mean deviation in decibels (dB) in glaucomatous eyes.