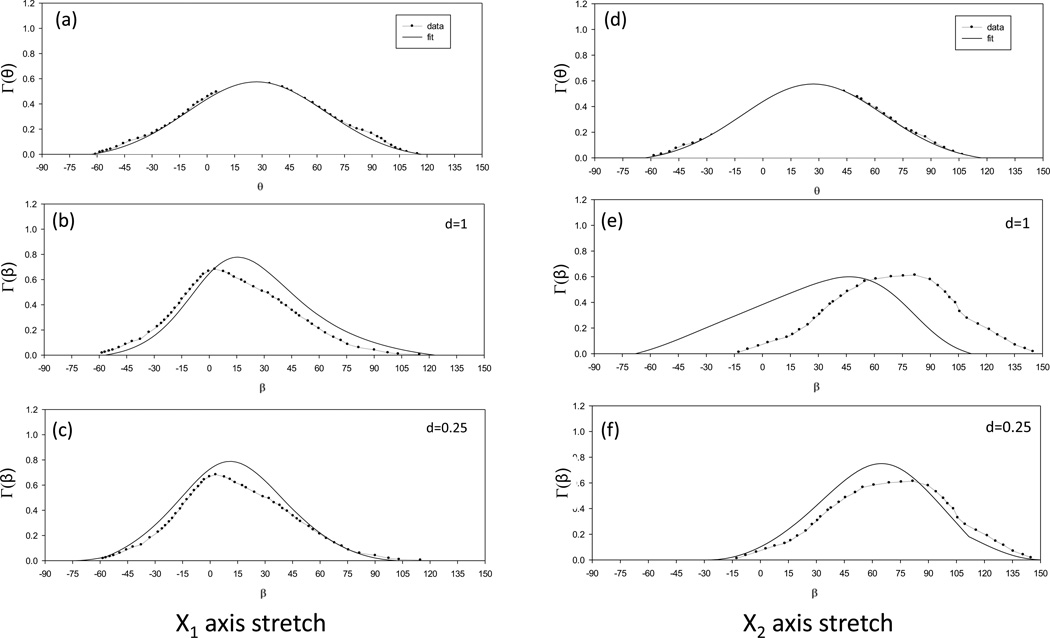
Figure 7.
Fiber angular distribution before and after stretch from SALS data from the Billiar and Sacks 1997 paper and simulation results with d=1.0 and d=0.25. To emulate the original data processing, both the original and simulated distributions were renormalized with the baseline component of the distribution removed.

