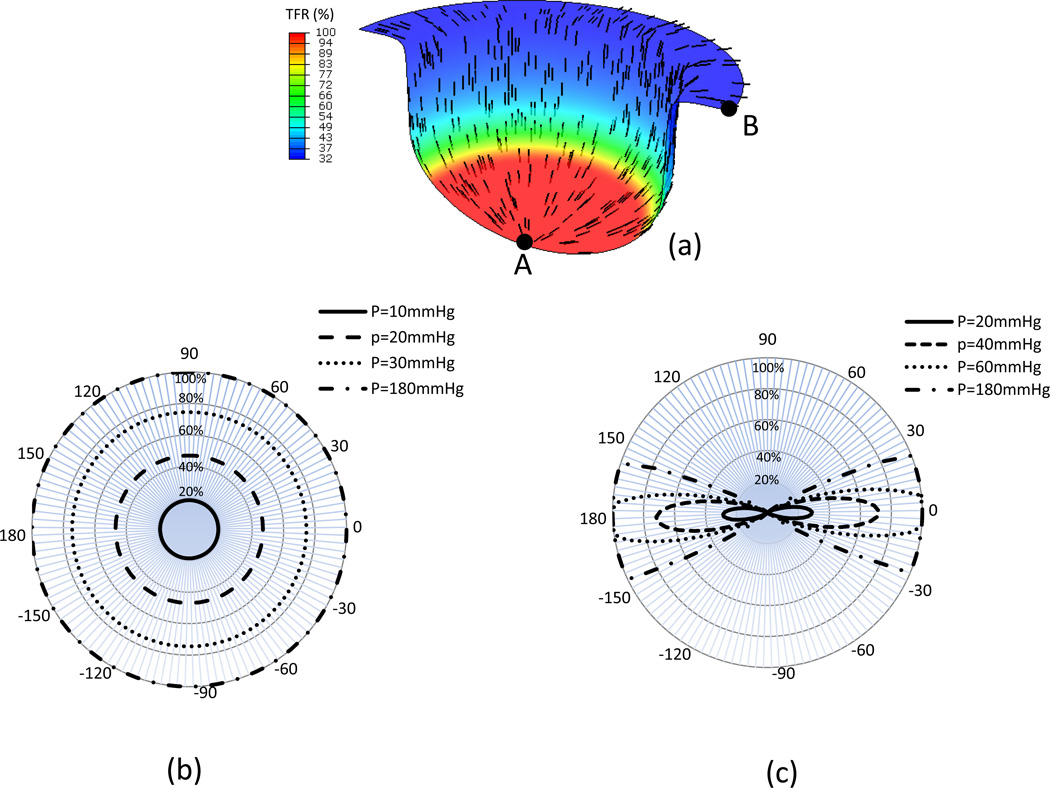
Figure 9.
Results from the membrane inflation simulations showing (a) preferred fiber orientation and total percentage of fiber recruitment contour from simulation, and the azimuthal plot of the fractional ensemble fiber recruitment of the elements located at (b) element A and (c) element B. Note here that while increased pressure loading predictably increased the total amount of fiber recruitment at both locations, substantial angular variations with pressure was observed at element B.

