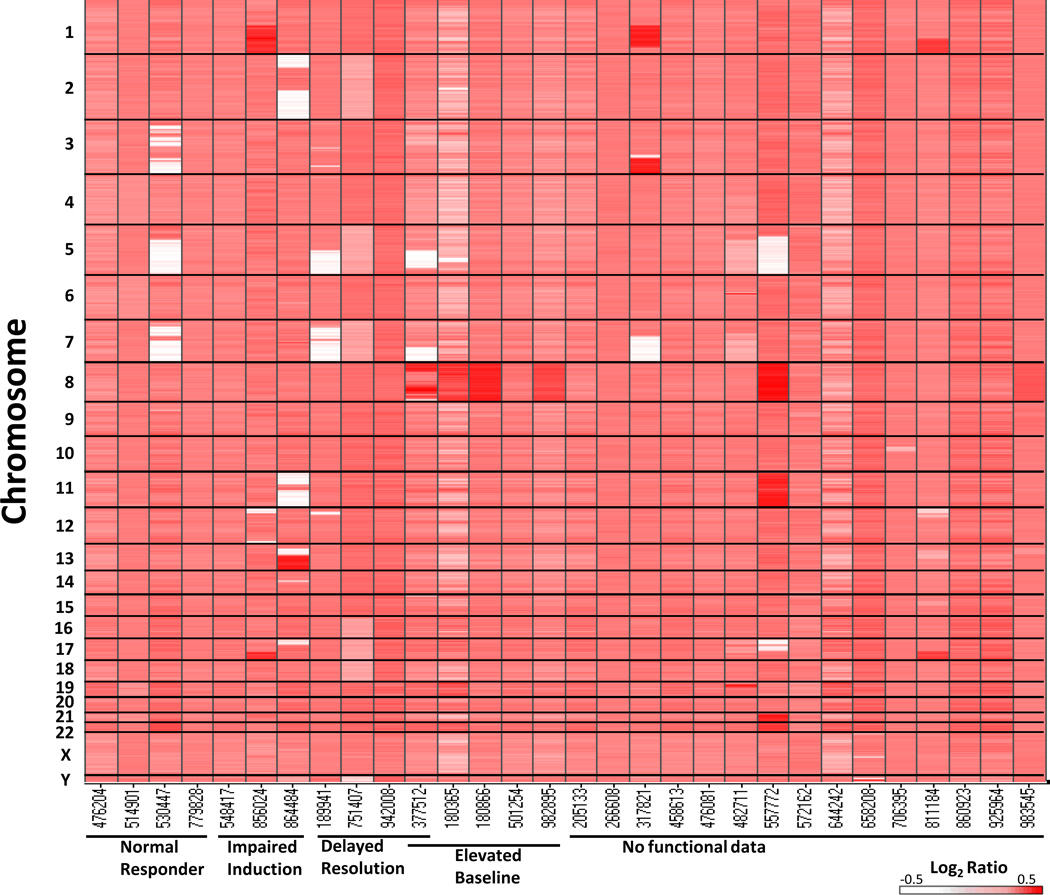
Figure 3.
Copy number alteration heat map for 30 t-AML genomes. The results of copy number analysis of 30 paired tumor and normal DNA samples assayed on a custom genome-wide array CGH platform with high resolution coverage of 170 DNA repair genes. Copy number is represented as the log2 ratio of tumor/normal DNA designated by a color range from white (deletion) to red (amplification). The Y-axis represents the chromosome number, with 1 on the top and Y on the bottom. The X-axis displays samples grouped by functional DSB category.

