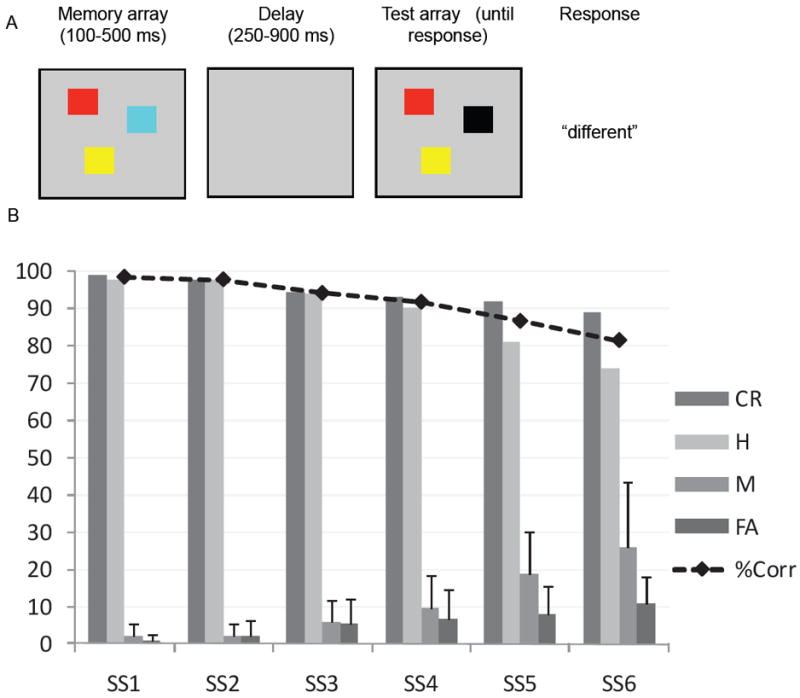
Figure 1.

(A) Schematic of the change detection task. (B) Behavioral results from change detection: across set sizes one through six, line shows percent correct, bars show proportion separated by response type. Error bars show one standard deviation. SS = set size, CR = correct rejections, H = hits, M = misses, FA = false alarms; note that CR and FA sum to 100, and H and M sum to 100.
