
FIGURE 2.
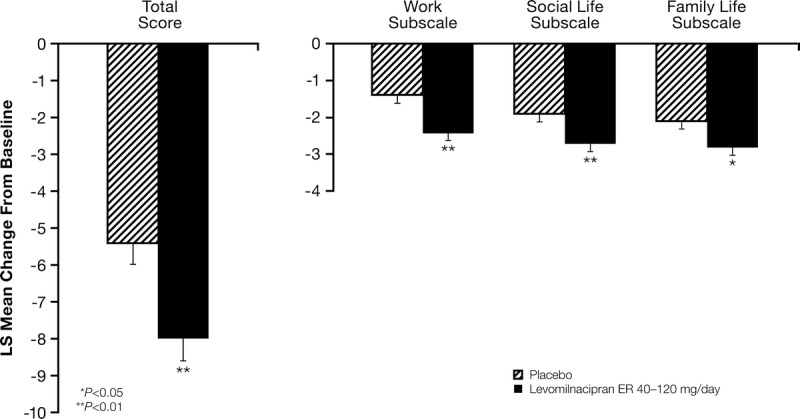
Sheehan Disability Scale change from baseline (least squares [LS] mean [SE]) to week 8 (Modified ITT population, MMRM).
Official websites use .gov
A
.gov website belongs to an official
government organization in the United States.
Secure .gov websites use HTTPS
A lock (
) or https:// means you've safely
connected to the .gov website. Share sensitive
information only on official, secure websites.
Sheehan Disability Scale change from baseline (least squares [LS] mean [SE]) to week 8 (Modified ITT population, MMRM).