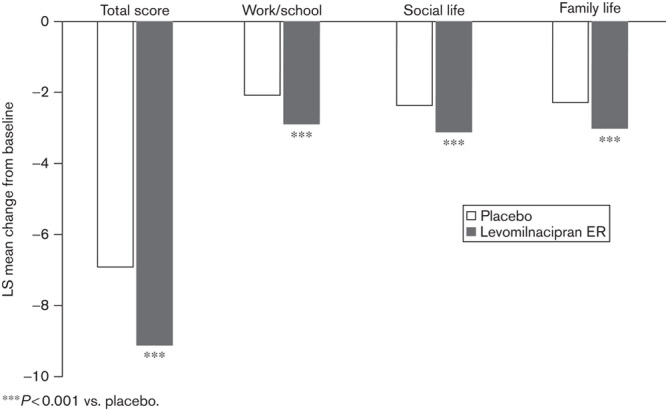
Fig. 3.

SDS total score and subscales: LS mean change from baseline to end of treatment in the overall patient population (MMRM, ITT population). ***P<0.001 vs. placebo. ITT, intent to treat; LS, least squares; MMRM, mixed-effects model for repeated measures; SDS, Sheehan Disability Scale.
