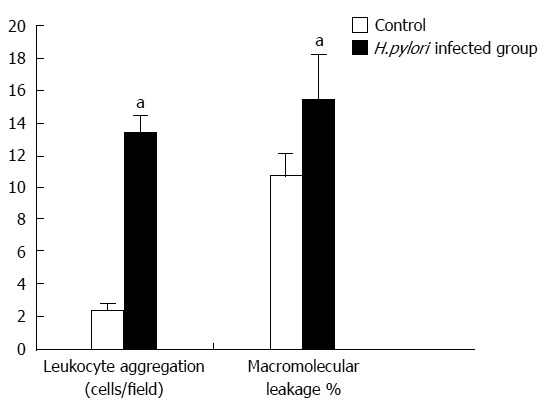
Figure 3.

Bar graph of the mean ± SE of adherent leukocytes and macromolecular leakage of control group compared with Helicobacter pylori-infected group. The leukocyte adhesion and macromolecular leakage in the H. pylori-infected group were significantly increased compared with the control group (aP < 0.01 vs control group). H. pylori: Helicobacter pylori.
