
Figure 3.
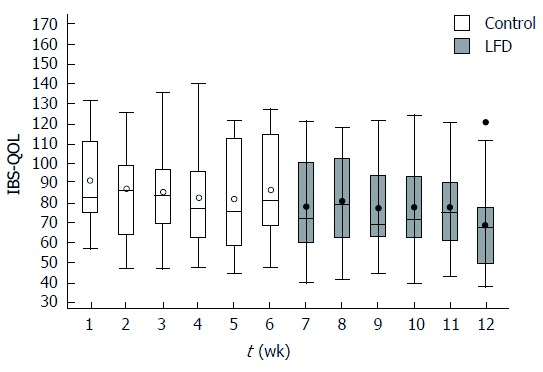
Box plot of irritable bowel syndrome quality of life (median, range per week) during 12-wk in 19 irritable bowel syndrome patients. Y axis: Irritable bowel syndrome quality of life (IBS-QOL) scores from 170 (worst) to 34 (best) points; X axis: Week 1-12. Control (normal diet) period: Week 1-6; LFD period: Week 7-12. FODMAP: Fermentable, oligosaccharides, disaccharides, monosaccharide’s and polyols; LFD: Low FODMAP diet.