FIGURE 2.
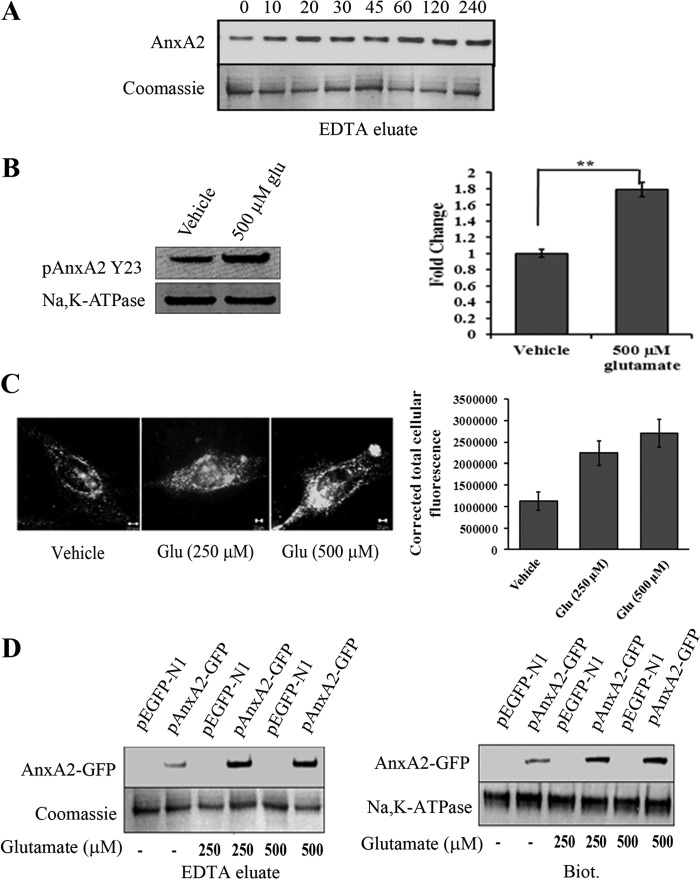
Glutamate induces cell surface translocation of endogenous and AnxA2-GFP in 661W cells. A, Western blot analysis of EDTA eluates from 661W cells treated with 500 μm glutamate for the indicated time periods. Coomassie staining of the EDTA eluates was used as a loading control B, EDTA eluates from 661W cells in the presence or absence of 500 μm glutamate for 4 h were collected and immunoblotted with pAnxA2 Tyr-23 antibody. Na,K-ATPase served as a loading control. Right panel, quantitation. **, p < 0.01. The fold change in pAnxA2 Y23 level with respect to vehicle control (1 m HCl) is shown. C, representative images of TIRF microscopy performed on vehicle control-treated (1 m HCl) and glutamate-treated (250 μm and 500 μm) 661W cells according to the procedures described above. The images were acquired at identical acquisition settings. A significant increase in the cell surface-associated levels of AnxA2 was observed in glutamate-treated 661W cells compared with the untreated controls. A graphical representation of mean relative fluorescence units (relative fluorescence units) of cell surface AnxA2 immunostaining was plotted after normalizing for the background intensity (right panel). D, 661W cells were transiently transfected with either the pEGFP-N1 empty plasmid vector or the AnxA2-GFP plasmid vector and treated with glutamate (250 μm and 500 μm) for 4 h. EDTA eluates and cell surface biotinylated extracts were collected. Western blotting with anti-GFP antibody revealed a 62-kD band representative of the AnxA2-GFP fusion protein, whose levels were up-regulated on treatment with glutamate (500 μm) in both the EDTA eluates (left panel, top row) and cell surface biotinylated extracts (Biot.) (right panel, top row). The fusion protein was not detected in the empty vector-transfected cells. Coomassie-stained bands and Na,K-ATPase were used as loading controls for EDTA eluates and biotinylated extracts, respectively. Each experiment was repeated three times (n = 3).

