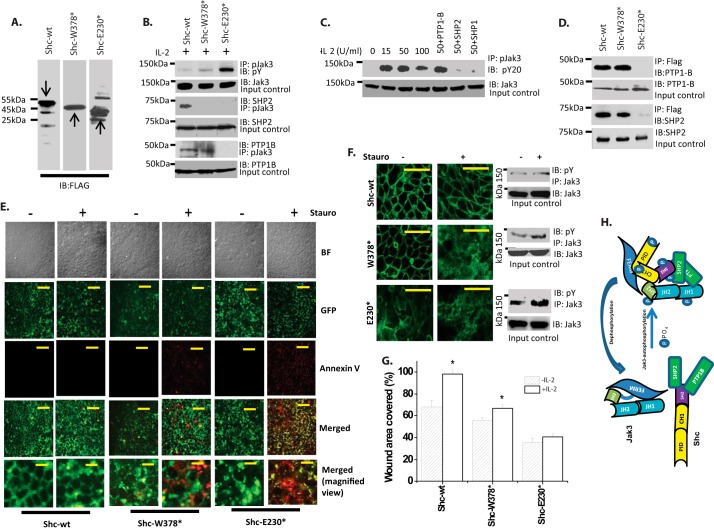
FIGURE 2.
Adapter protein Shc regulates Jak3 activation through regulating Jak3 interactions with tyrosine phosphatases. A, Western analysis for the expression of FLAG-tagged ShcA-wt or its mutants was done using lysates from stably transfected HT-29 Cl-19A cells and FLAG antibody. B, Western analysis of co-immunoprecipitates from cell lysates of stably transfected cells from A treated with IL-2 (50 units/ml) were done using indicated antibodies for phosphotyrosine (pY), phospho-Jak3 (pJak3), and tyrosine phosphatase SHP2 and PTP1B using previously reported protocols (8). C, dephosphorylation of phospho-Jak3 was determined using in vitro phosphatase assay using P-Jak3-immunoprecipitated Jak3 from cell lysates of IL-2-treated HT-29 Cl-19A cells as described under “Experimental Procedures”. pY20, phosphotyrosine antibody from clone PY20. D, direct interactions between recombinant purified proteins of FLAG-tagged-ShcA-wt or mutants and indicated phosphatases were determined by pairwise binding assay as in Fig. 1, and protein complexes were immunoprecipitated using the indicated antibodies followed by IB by FLAG antibodies. For input controls IB was done using the indicated antibodies for phosphatases. E, susceptibility toward staurosporine-induced apoptosis was determined in stably transfected cells from A using a GFP-certified apoptosis assay kit as reported before (7). Yellow color in the Merged panels shows GFP and annexin V co-localized apoptotic cells, whereas green color indicates nonapoptotic healthy cells. F, immunofluorescence microscopy on control or staurosporine-treated cells (Stauro) from E was done using Alexa Fluor 488-conjugated phalloidin to stain F-actin. Right panels, P-Jak3 was assessed in cells from F and G using IP and IB with the indicated antibodies. G, wound closure was measured as a percentage of the original wound area as reported before (8). H, model for Shc-mediated Jak3 dephosphorylation. G, values are mean ± S.E. * indicates statistically significant differences from IL-2, p < 0.05, n = 3 experiments. E and F, images were stacked and processed using NIS Element software (Nikon). Representative blots (A–D and F) or images (E and F) are shown from n = 3 experiments. Scale bar, 14 μm.

