FIGURE 3.
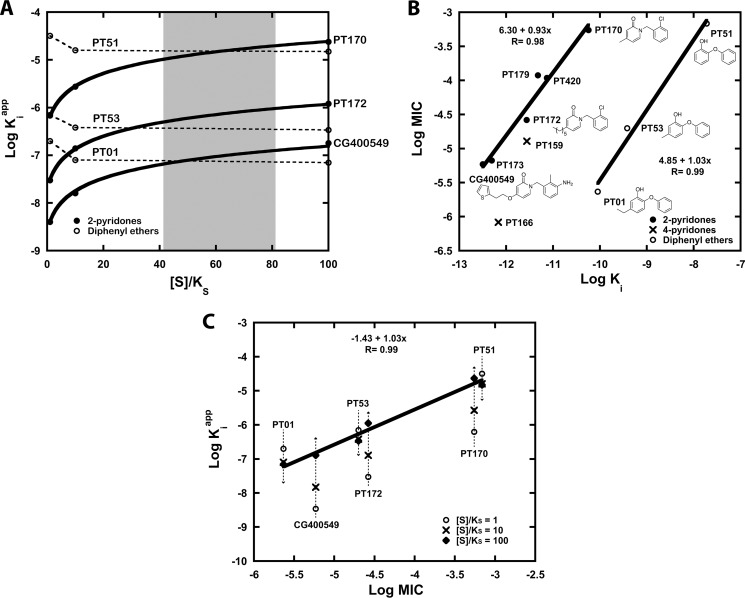
Rationalizing the in vitro cellular potency of competitive and uncompetitive FabI inhibitors. A, relationship between acyl substrate concentration as a multiple of KS ([S]/KS) and the apparent affinity (Kiapp) of pyridones (PT170, PT172, and CG400549) and diphenyl ethers (PT51, PT53, and PT01) is illustrated. The plots are simulated based on Ki values against saFabI (Table 1) (31), the mechanism of inhibition shown in Fig. 2B, and the kinetic model described in Ref. 31. The range of substrate concentration that best correlates relative Kiapp to relative MIC for both classes of compounds is shaded in gray. B, double logarithmic plot depicts a strong linear correlation between Ki of the overall ternary complex (Ki × Kd, NADP(H)) and MIC for the 2-pyridone series (●) and diphenyl ethers (○). Points corresponding to 4-pyridones (×) are superimposed. Note that in this plot, the MIC for PT170 was assumed to be 550 μm, which is a lower limit estimate. C, this double logarithmic plot of Kiapp and MIC illustrates how 2-pyridones and diphenyl ethers can lie on the same linear correlation at the estimated substrate concentration [S] in the cell. Data points correspond to inhibitor Kiapp values at [S]/KS of 1 (○), 10 (×) and 100 (♦). The linear correlation for points corresponding to [S]/KS = 100 is depicted.

