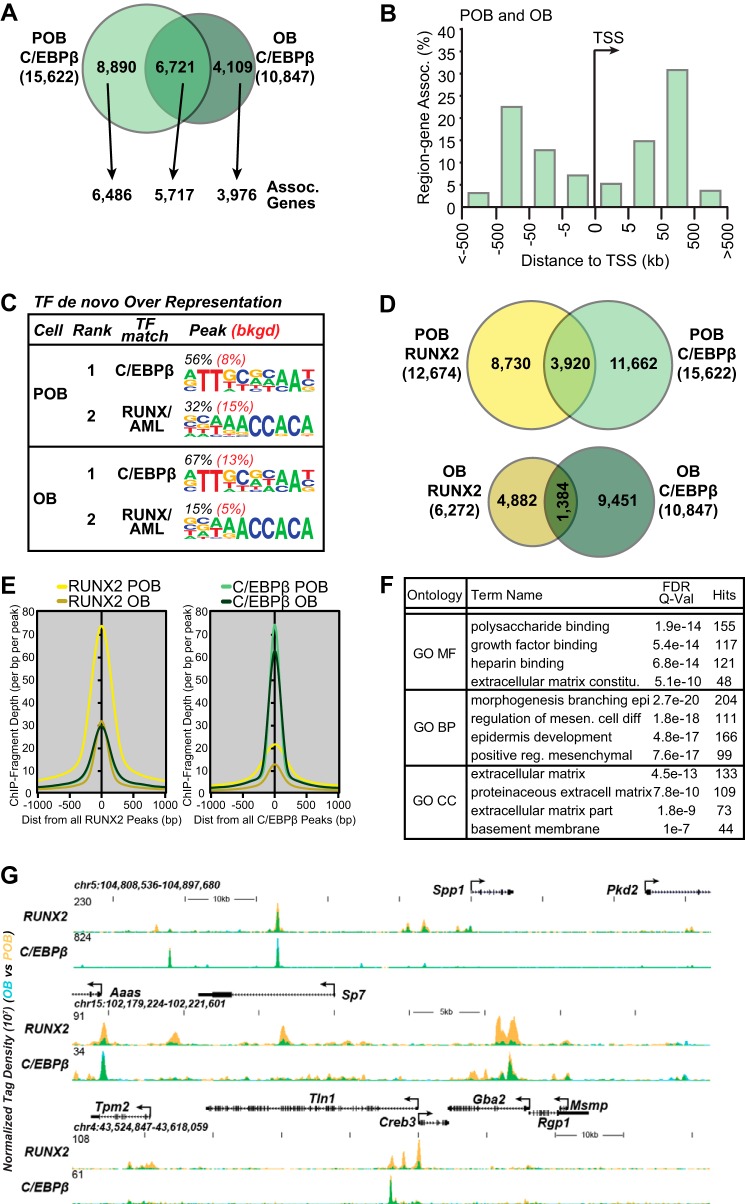
FIGURE 3.
Association of C/EBPβ with RUNX2. A, Venn diagram depiction of replicate normalized C/EBPβ binding sites assessed using HOMER in POB and OBs. Arrows link the C/EBPβ binding site subsets (POB specific, OB specific, and POB/OB overlap) to annotated neighboring genes using GREAT. B, GREAT analysis of C/EBPβ sites as a function of distance from TSS in kilobases (kb) for both POB and OB. C, de novo sequence over-representation analysis of C/EBPβ peaks by HOMER in POBs and OBs. Abundance shown as percentage (black) compared with 50,000 GC content matched sequences (red). D, Venn diagram overlap of RUNX2 and C/EBPβ peaks for both POB and OBs. E, ChIP-seq tag density (ChIP-Fragment Depth per bp per peak) for all RUNX2 peaks (left) and all C/EBPβ peaks (right). RUNX2 peaks for POB (yellow) and OB (dark yellow), C/EBPβ peaks for POB (green) and OB (dark green). F, the top 4 scoring Gene Ontology (GO) terms are presented for Molecular Function (MF), Biologic Process (BP), or Cellular Component (CC) for the regions in which RUNX2 and C/EBPβ overlap. G, ChIP-seq tag density tracks for RUNX2 and C/EBPβ (POB, yellow; OB, blue; overlap, green). Further details as in Fig. 2.

