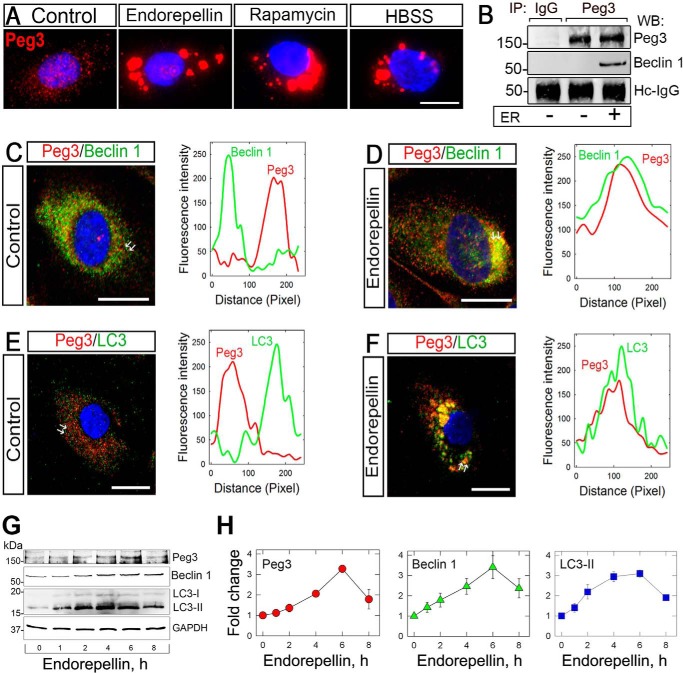
FIGURE 3.
Peg3 expression is affected by endorepellin promoting its interaction and co-localization with the autophagic markers Beclin 1 and LC3 in HUVEC. A, immunofluorescence images showing increasing expression of Peg3 upon endorepellin treatment (200 nm) in HUVEC. HBSS and rapamycin (40 nm) served as positive controls. B, representative co-immunoprecipitation of HUVEC stimulated with endorepellin (ER) (200 nm) for 6 h. The cells were lysed, immunoprecipitated (IP) with an anti-Peg3 antibody, and subjected to Western blot (WB) with anti-Peg3 anti-Beclin 1 as indicated. Nonspecific IgG served as negative control. The experiments were repeated three times with comparable results. Hc-IgG, heavy chain IgG. C–F, confocal images of Peg3 and Beclin 1 or Peg3 and LC3 co-localization in HUVEC upon a 6-h treatment with or without endorepellin (200 nm). The line-scanned profiles are next to each confocal image. The white arrows in the confocal images represent the distance within which the scans were generated. Bar, 10 μm. G, representative Western blot of various proteins, as indicated on the right margin, in HUVEC following time course treatment with soluble endorepellin (200 nm). H, quantification of three independent experiments as in G. Data represent the mean ± S.E.

