
FIGURE 4.
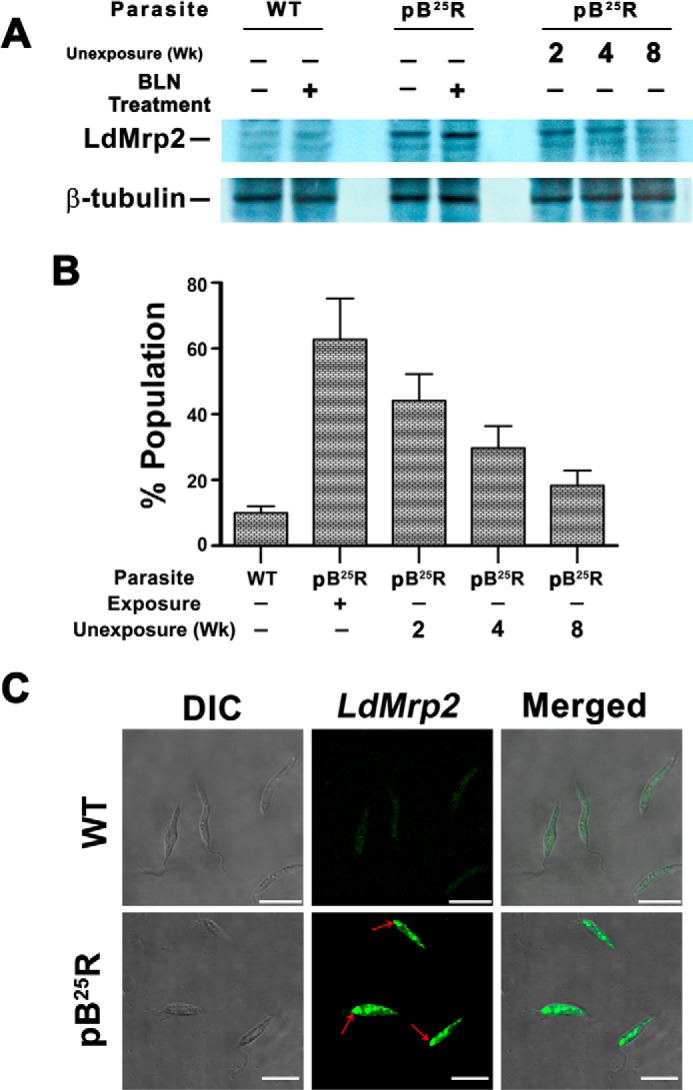
A, up-regulated expression of LdMRP2 in pB25R parasites. Shown is Western blot analysis of total proteins from sensitive Leishmania parasites (WT) and L. donovani parasites resistant to 25 μm BLN (pB25R) either incubated with BLN (lane 2 for WT and lane 4 for pB25R parasites) or in the absence of BLN (lane 1 for WT and lane 3 for pB25R parasites) using an anti-LdMRP2 antibody raised in rabbit using the first 130 amino acids of LdMRP2 protein. Molecular mass standards (kDa) are from Roche Applied Science. The reversal of phenotypic expression was also checked after long term exposure to BLN as indicated. B, flow cytometry analysis of a population of MRP2 protein-expressing pB25R parasites. WT or pB25R parasites were fixed followed by permeabilization with 0.1% Triton X-100. The parasites were incubated with polyclonal rabbit LdMRP2 antiserum (1:200) and finally visualized by fluorescein-conjugated secondary antibody (Atto 488), and the population of positive cells was counted using a BD Biosciences flow cytometer. C, intracellular localization of LdMRP2 inside parasites. WT or pB25R parasites were fixed and permeabilized with 0.1% Triton X-100. The parasites were stained with polyclonal rabbit antiserum followed by fluorescein-conjugated secondary antibody (Atto 488). The images shown are differential interference contrast images (DIC) (left), fluorescence only images (Atto 488) (middle), and a merge of the differential interference contrast and GFP images (right). Arrows indicate the region of the flagellar pocket. Scale bars, 10 μm. Error bars represent S.D. wk, weeks.