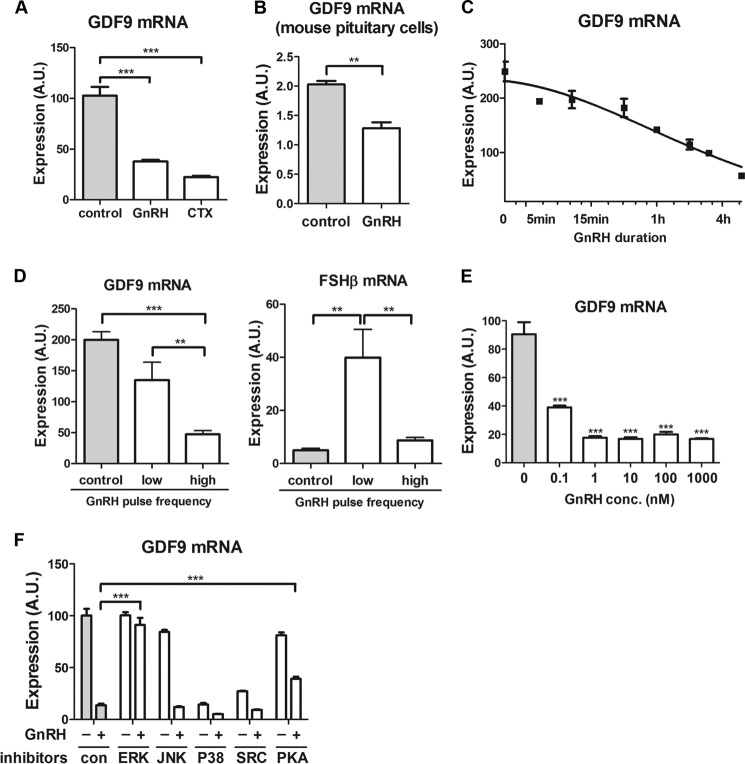
FIGURE 1.
GDF9 gene responsiveness to GnRH stimulation in gonadotrope cells. A, LβT2 cells were serum-starved overnight and stimulated with 5 μg/ml CTX, 1 nm GnRH, or vehicle (control) for 10 h. One-way ANOVA was used. ***, p < 0.001; **, p < 0.01; *, p < 0.05. B, primary pituitary cells from adult mice were stimulated with 5 nm GnRH or vehicle for 12 h. C, LβT2 cells were stimulated with 1 nm GnRH or vehicle for the indicated times and harvested 6 h after exposure to GnRH. The data are shown on a log2 scale. D, LβT2 cells were stimulated with 2 nm GnRH for 8 h at either low pulse frequency (2-h interpulse intervals) or high pulse frequency (30-min interpulse intervals). E, LβT2 cells were stimulated with increasing concentrations of GnRH ranging from 0.1 nm to 1 μm for 5 h. F, LβT2 cells were pretreated with various pharmacological inhibitors (JNK, p38, Src, PKA, and ERK inhibitors at 10 μm final concentration) for 30 min, and cotreated with 1 nm GnRH for 6 h. GDF9 and FSHβ mRNA expression levels were determined by qPCR. One-way ANOVA with Bonferroni post-test corrections was used. ***, p < 0.001; **, p < 0.01; *, p < 0.05. The data shown are mean ± S.E. (error bars) of triplicate samples from one experiment and are representative of three independent experiments. A.U., arbitrary units.

